2023 Full Year Energy Data: 27.9 tonnes CO2 eliminated & £21,000 cash saved.

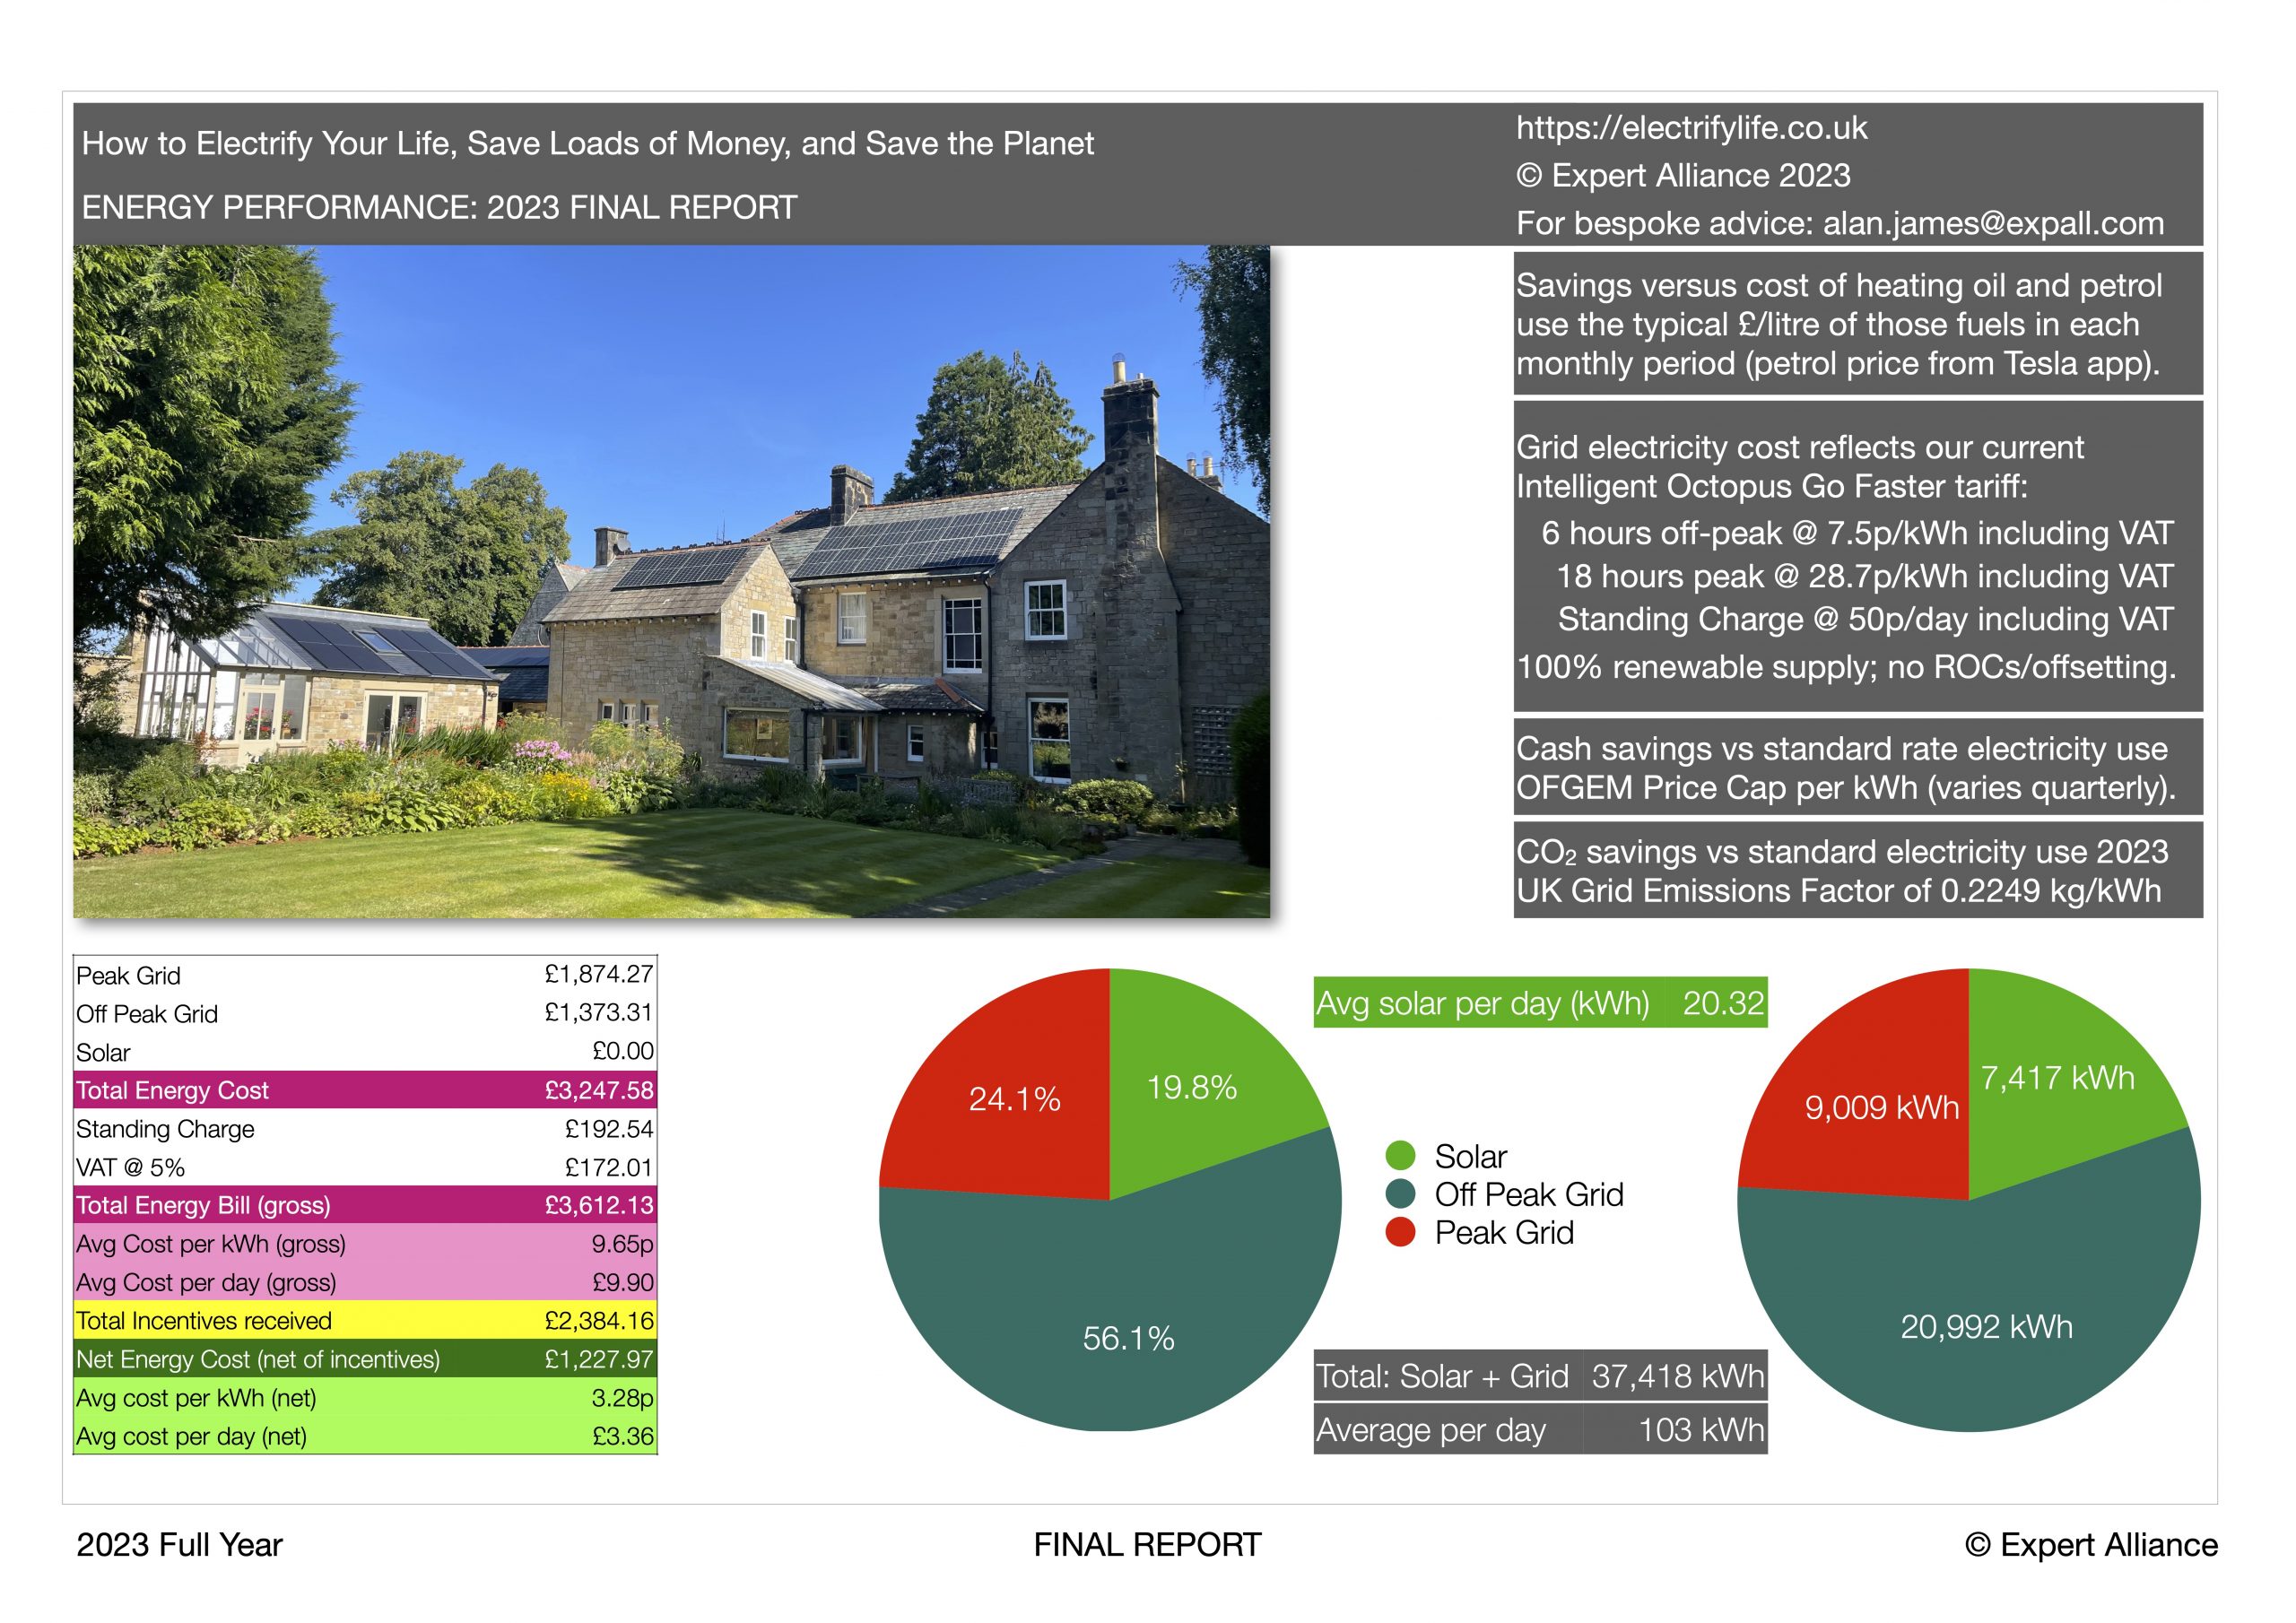
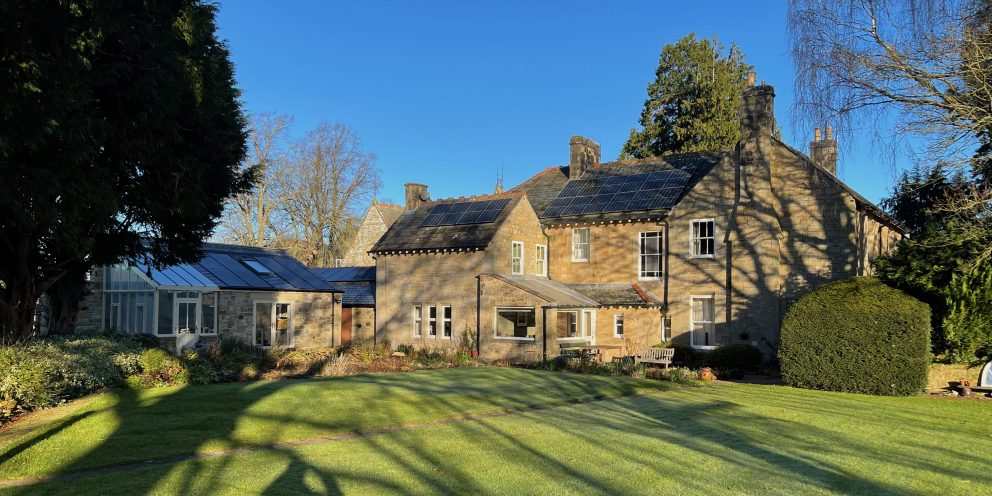
We have now assembled the 2023 full year data for energy performance, cash savings, and emissions reduction at our home, resulting from our use of electricity for all our driving, heating, lighting, and all other domestic uses. The results, summarised in this infographic are strongly positive, and have improved cash and carbon savings by around 10% Year on Year, even compared to the very good results achieved in 2022.

In short, we eliminated 27.916 tonnes of CO2 emissions and saved £21,118 in cash

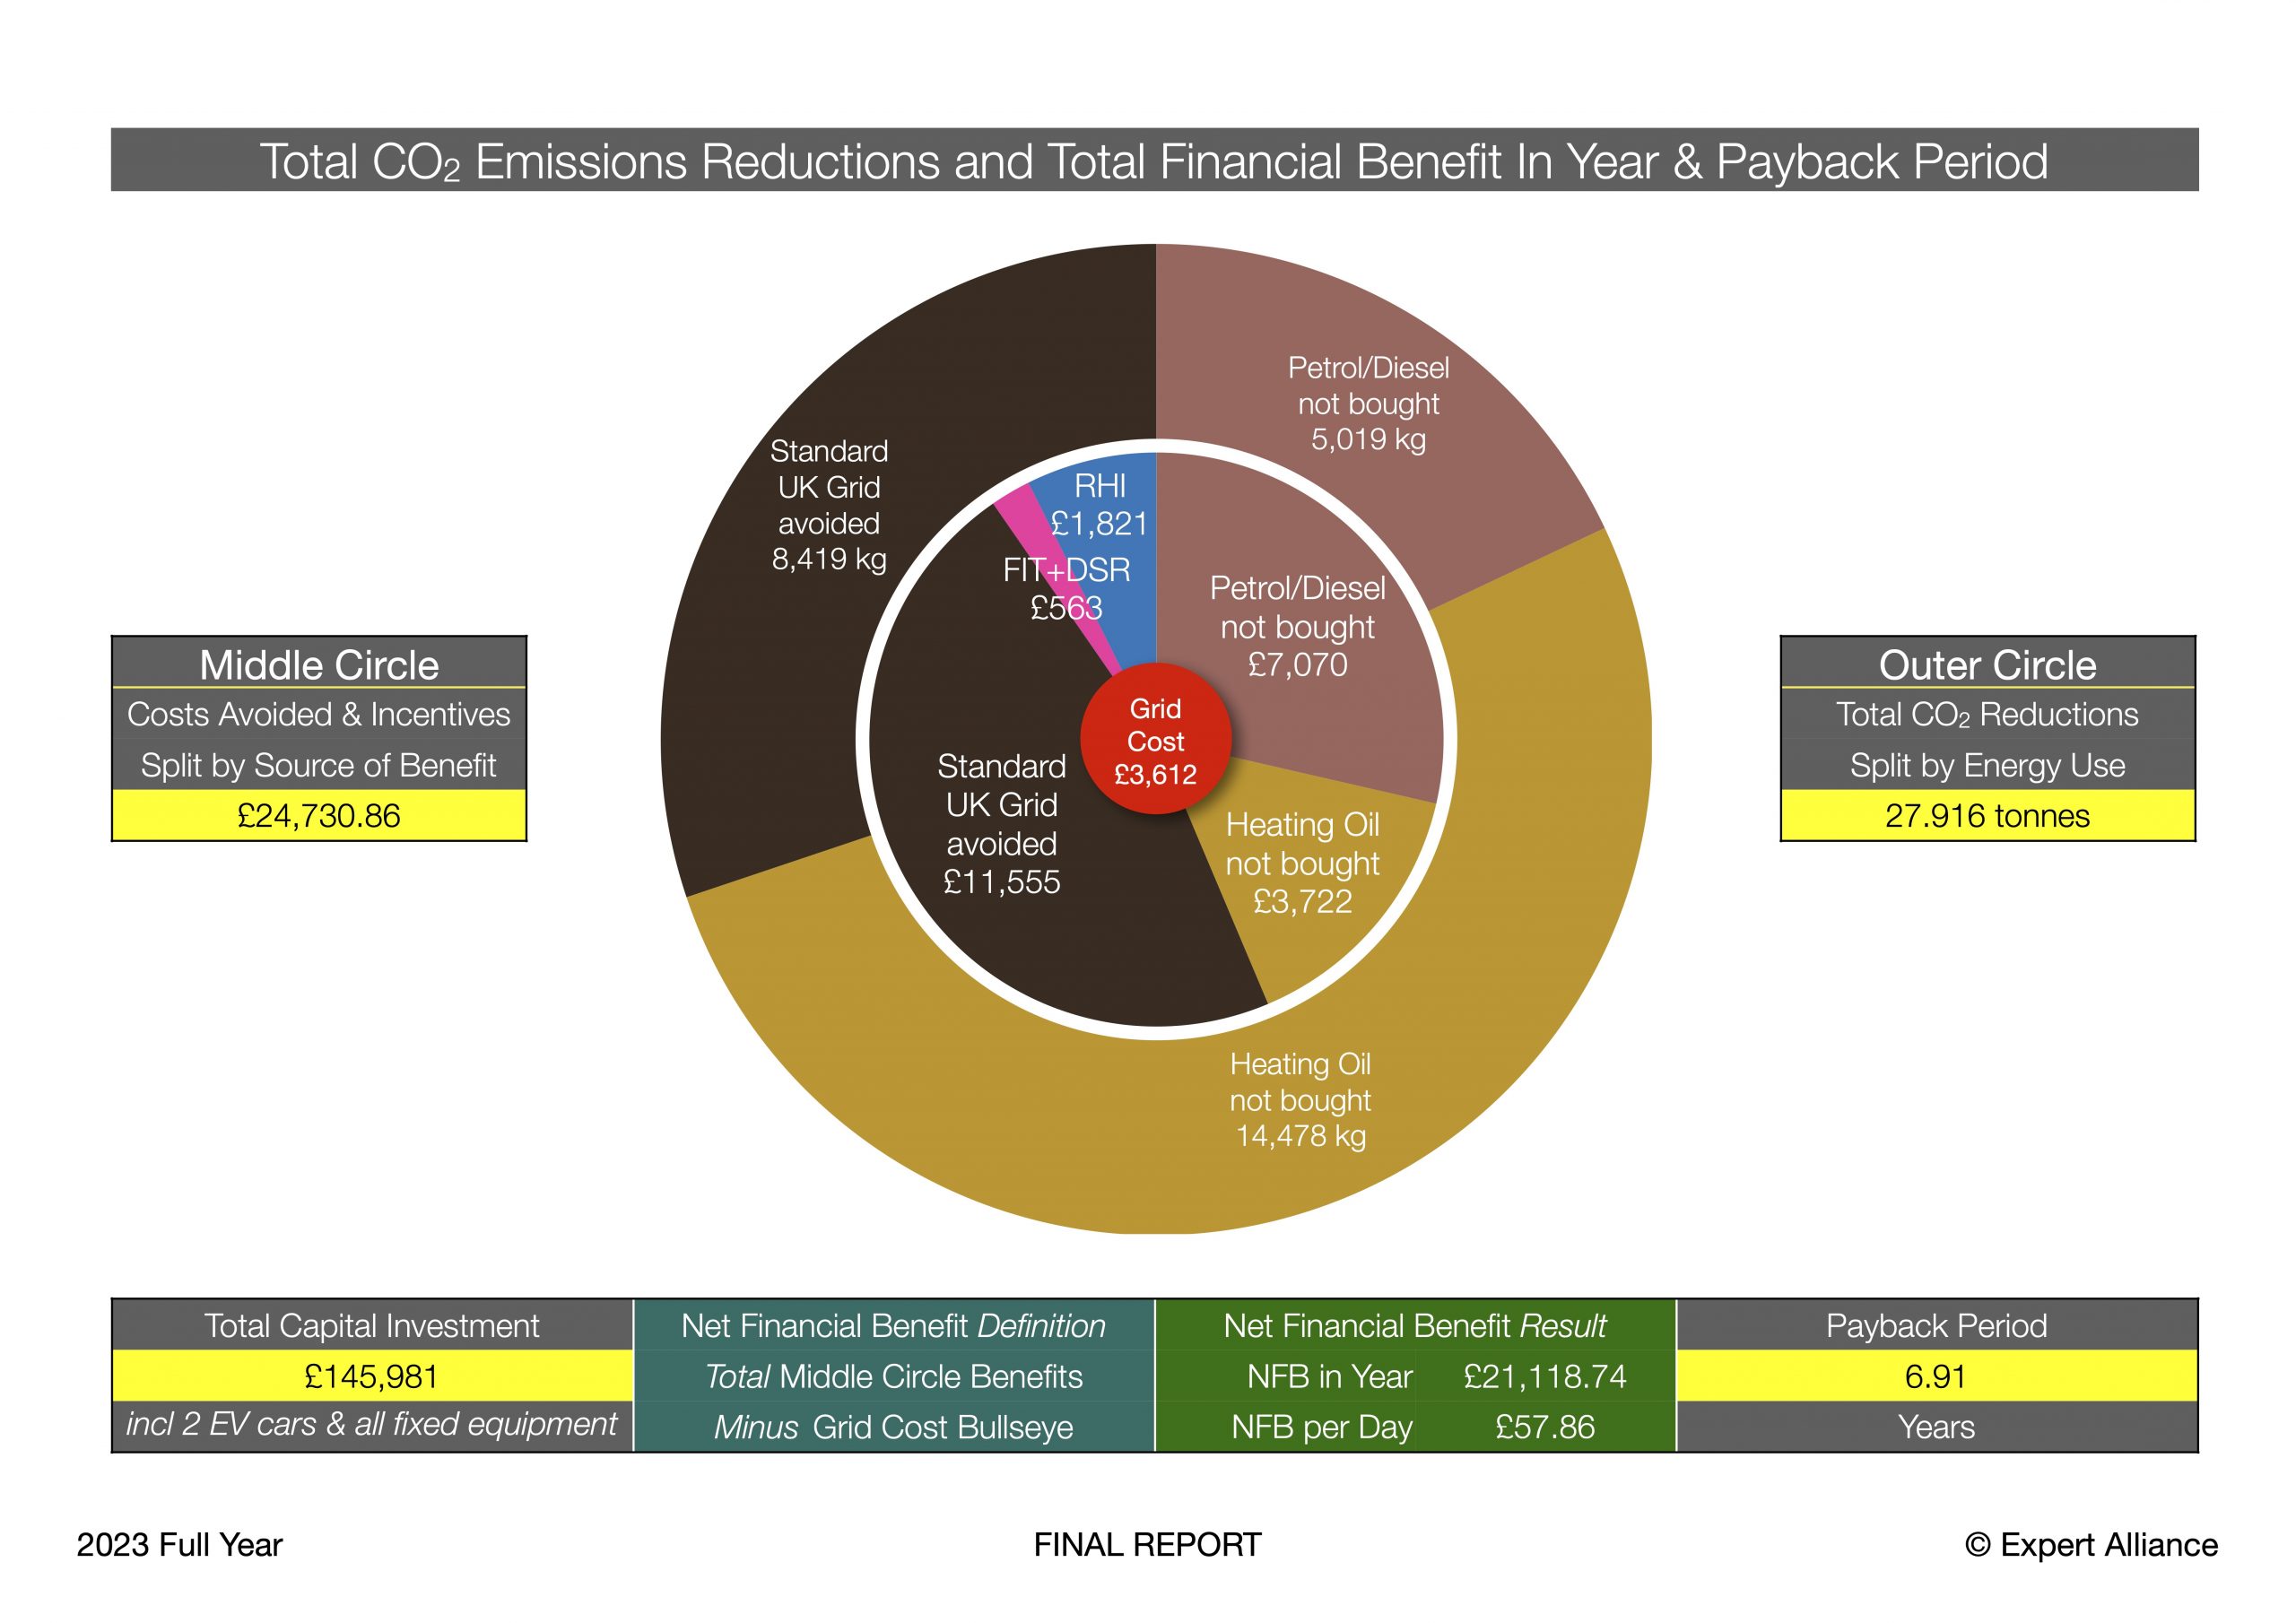
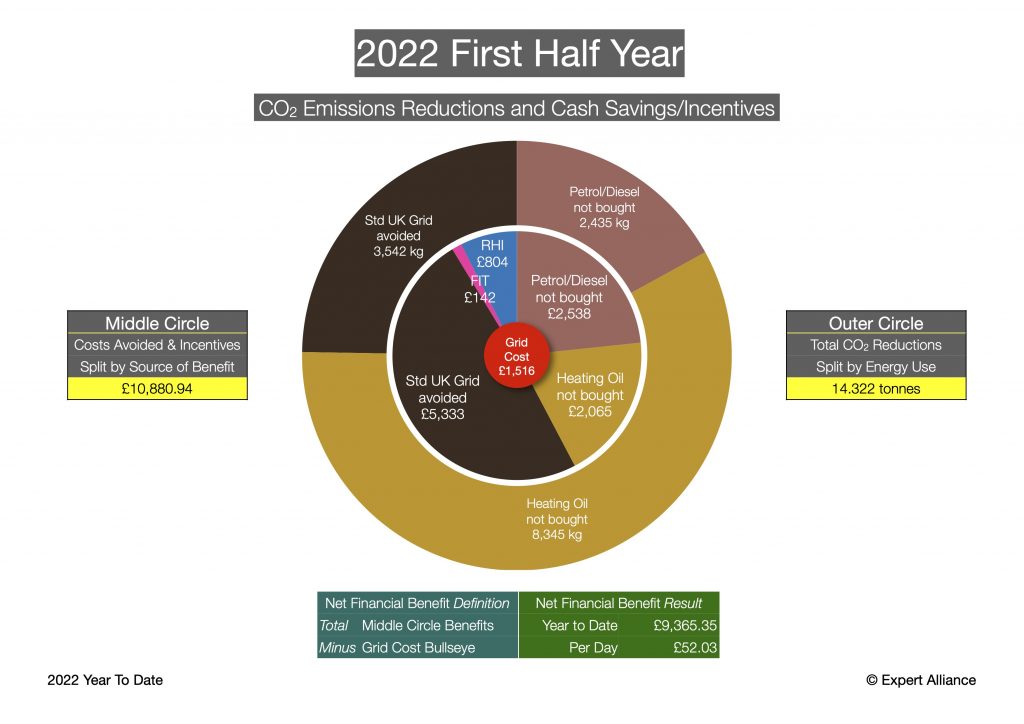
Our savings of 27.916 tonnes of CO2 emissions and £21,118 in cash, are calculated compared to an ‘OldTech’ baseline as follows:

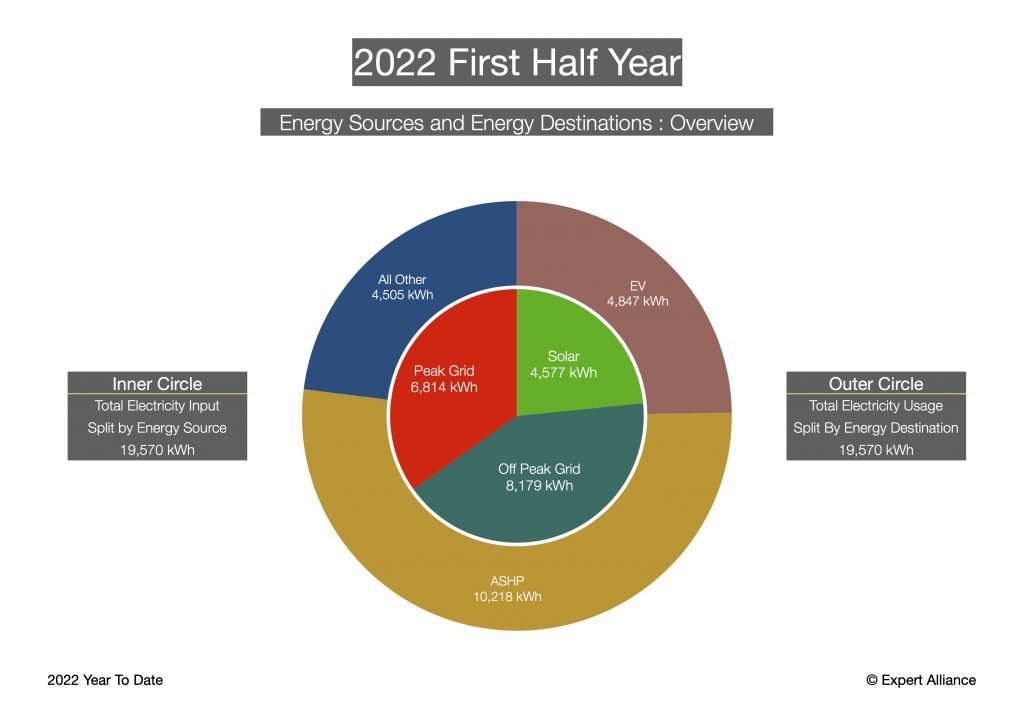
  • Driving 25,817 miles (41,548 km) in EVs, rather than petrol cars of equivalent size, saved us over £7,000 in cash and eliminated around 5 tonnes of CO2 emissions.
  • Using an Air Source Heat Pump (ASHP), rather than an oil boiler, for central heating and domestic hot water, saved us nearly £4,000 in cash and eliminated around 14.5 tonnes of CO2 emissions.
  • Maximising the use of our on-site batteries to import cheap off-peak grid power, and to store the surplus energy from our 7.5MWh of on-site solar generation, saved us well over £11,000 in cash compared to the UK regulated ‘Price Cap’ rate per kWh. Using an officially-certified 100% renewable electricity tariff also eliminated around 8.5 tonnes of CO2 emissions compared to the UK grid average for all suppliers.
  • We also received around £2,400 in Government incentive payments, which pay out gradually over time to offset some of the upfront costs we incurred for installing some of the solar array (Feed In Tariff – FIT) and the ASHP (Renewable Heat Initiative – RHI). 
  • A small part of the incentives received, just over £100, was paid by our energy supplier for our participation in the National Grid Demand Flexibility Service during November and December 2023. DFS pays consumers not to use electricity at times of grid stress, which typically occur when renewable generation is low and demand is high in the evening peaks. Not using electricity in these periods reduces the need to switch on polluting coal and gas fired power stations. Because we have 39 kWh of battery storage available, we are able reduce our grid consumption to absolute zero during the DFS ‘Savings Sessions’.

The ‘hard cash’ economics worked out as set out below.

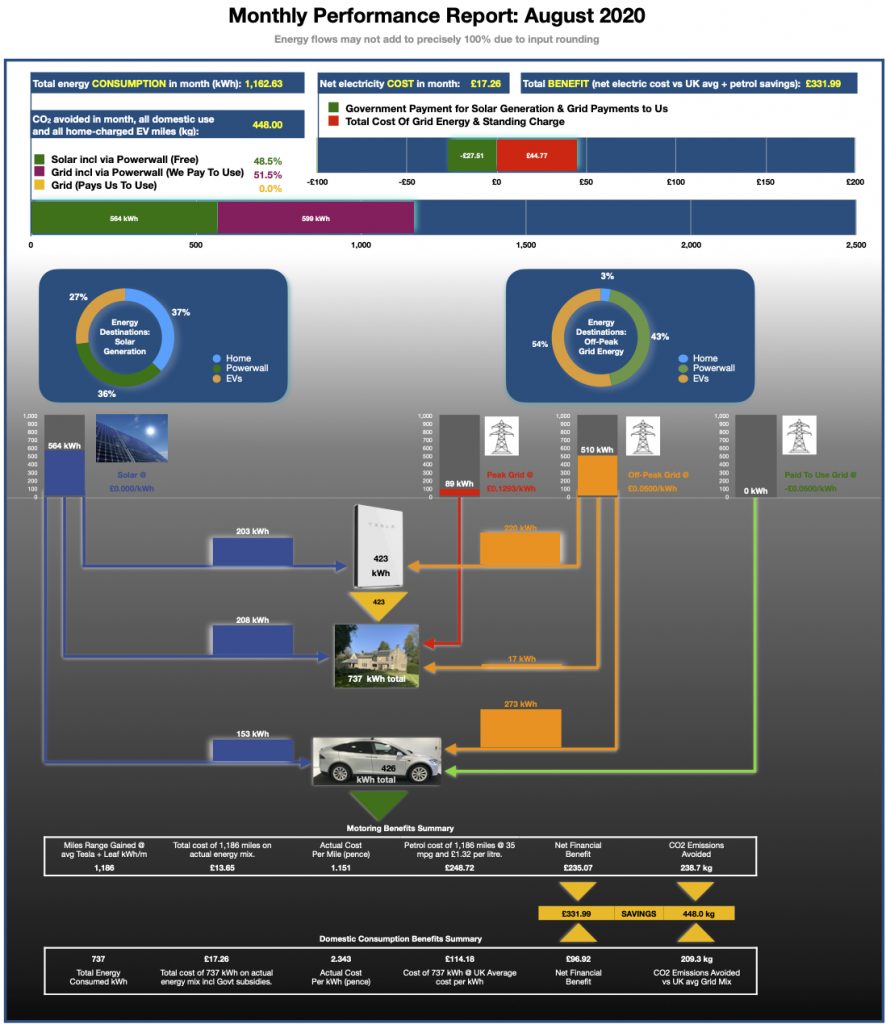
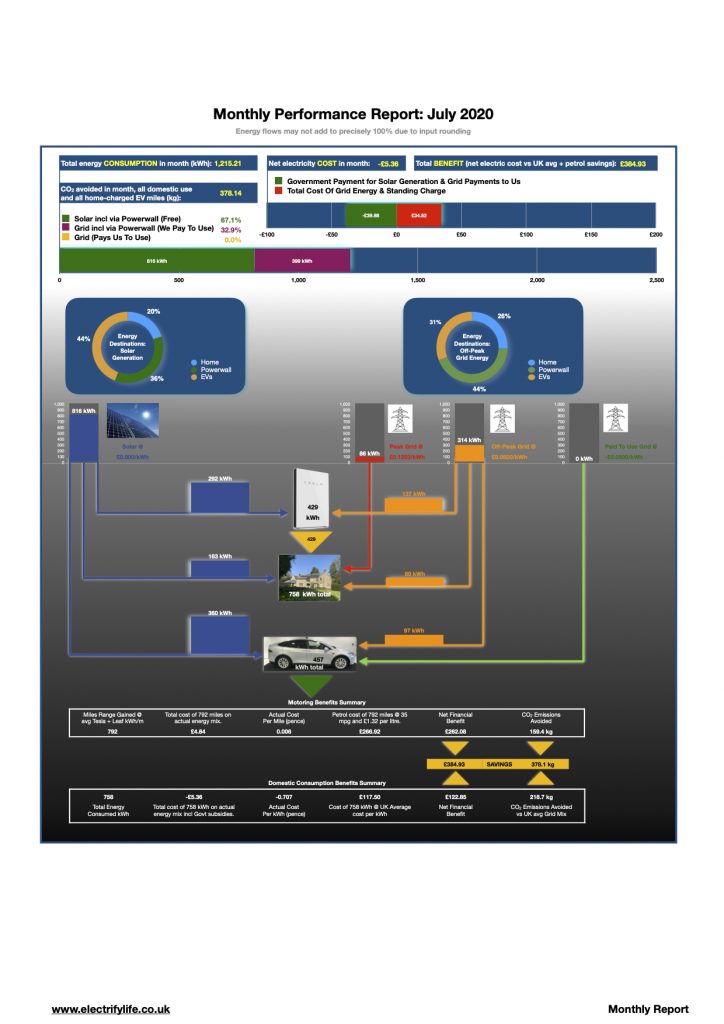
  • Our total energy cost for 2023 was was £3,612 paid to our grid electricity supplier. This one cost covers all the energy we used to power and heat our home, and to power the 25,817 miles (41,548 km) we drove in our cars.
  • Offsetting this cost, we saved a total of £22,347 by not buying petrol for the cars, by not buying heating oil for a boiler, and by leveraging our batteries to access a Smart Energy grid supply tariff and therefore not buying energy at the OFGEM ‘price cap’ rate for standard rate electricity.
  • Further offsetting the cost, we also received a total of £2,384 in FIT, RHI and DFS incentive payments.
  • The 2023 full year Net Financial Benefit to us was £21,119. (£22,347 + £2,384 – £3,612)
  • Our total net cost of energy for the full year 2023 was only £1,228, covering all home and motoring consumption. This result is produced by subtracting the £2,384 incentive payments we received from the £3,612 bill we paid to our grid electricity supplier.
  • Therefore, our total energy cost was only £3.36 per day, which is less than the typical £4.05 price of a Grande Cappuccino at a well-known coffee chain.
  • The net price we paid for electricity after incentives was only 3.28p per kWh, averaged over the year. This takes into account our mix of 19.8% solar, 56.1% off-peak grid, and 24.1% peak grid usage.  This compares with the OFGEM ‘price cap’ rate, which varied between 26.58p/kWh and 33.66p/kWh during 2023, in our grid region (Northern England).
  • We achieved these savings using the Intelligent Octopus Go Faster tariff for our grid energy. This excellent package works really well for us, providing a minimum of 6 hours cheap overnight electricity at around 25% of the peak-hours cost, but it’s only available to customers who have an electric vehicle. Here’s a link if you’d like to know more. If you sign up to Octopus via the link you will receive £50 off your first bill. For full disclosure, we will receive a £50 referral bonus.

During 2023 the difference in cost between off-peak and peak electricity prices widened significantly as a result of the Ukraine war. This prompted us to invest in one further Tesla Powerwall battery, additional to the two already installed, primarily to increase our capacity to import very cheap overnight off-peak electricity, which now costs around four times less than peak-time power.

The additional battery increased the total capital we have invested to nearly £146,000, but bear in mind that this figure includes two EV cars (a Tesla Model X and a Nissan Leaf), in addition to a 32 panel solar array, and the 3 Tesla Powerwall batteries installed in phases over approximately a decade from 2014 onwards, and a complex ASHP system added in late-2021. 

Despite the heavy up-front capex, the system is performing ahead of projections, and is on course to fully pay back the £146,000 investment cost in a total of 6 years 11 months. Taking into account the lower savings we achieved as parts of the system were gradually installed over the seven year period 2014 to 2021, plus the £19,000 we saved in 2022, plus the £21,000 saved this year, we’re accounting the system as 75% paid-off at 31 December 2023. Depending on the amount of sunshine and the price of grid energy, we expect the system to have fully paid for itself by around mid-2025, fully including the cost of both cars. From that point onwards, it’s ‘pure upside’.

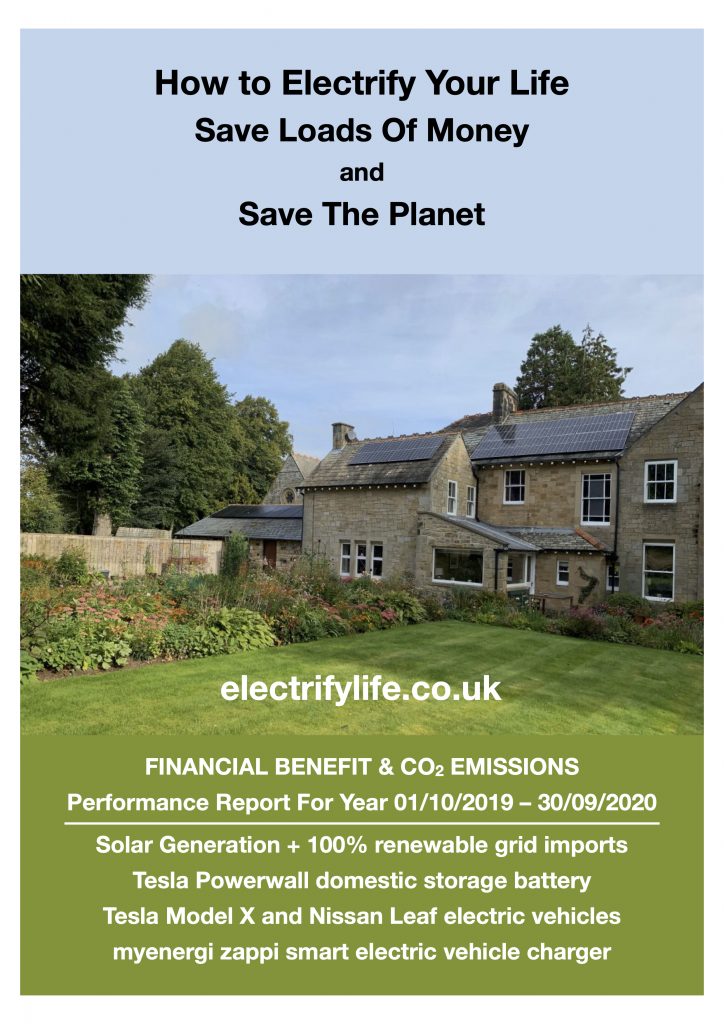
Comprehensive data is available in the 2023 Final Report here. It’s a 15 page PDF which presents the information summarised here in full. It can also be accessed by clicking the image at the end of this post.

For comparison, you can view the 2022 Final Report here. In that year, we saved over £19,089 in energy costs, and eliminated 25.5 tonnes of CO2 emissions.

Some thoughts on policy & Net Zero finance

We recognise that we are dealing with a large house here, and that (because we have worked hard and taken risks in our careers) we are in the fortunate position of being able to invest capital up front, in order to save operating costs over time. We fully acknowledge that only a minority of people are in such a position.

In part, we are publishing this data to show what can be achieved if a means is found to enable every household to afford the up-front cost of installing the technologies that will get us collectively to Net Zero.

In this broader context, the data we are publishing provides hard evidence, for policymakers as well as individual citizens, of the financial benefits which flow over time to households making an upfront capital investment in Net Zero technologies. 

Although the GreenTech investment in the average home is likely to be smaller (and therefore cheaper), it is self-evident from the results that the substantial financial benefits accruing to any household making such an investment will provide a sustained and predictable stream of income and/or savings. It is precisely this long-term financial predictability which unlocks the possibility of mortgage lenders or social housing finance providers advancing the necessary up-front capital, to be repaid over time from a contractually-guaranteed slice of the savings. 

Such an arrangement could perhaps be underwritten by some form of Government ‘backstop of last resort’ if required. Governments frequently provide such ‘backstops’, to underpin the long term finances of centralised projects, such as multi-decade programmes to build nuclear power stations which produce electricity, for example. 

Far more rapid results will be achieved by decentralising the investment over the tens of millions of households which consume electricity, most notably by decarbonising domestic heating, by substituting ASHPs for gas boilers, and by installing ‘edge of grid’ energy storage in every home and business premises. Such storage essentially ‘parks’ surplus renewable energy, distributed gradually in off-peak hours, where it’s actually needed. This is a far more rational, and massively cheaper, alternative to agglomerating surplus renewables only in multi-billion pound centralised storage, which then requires multi-billion pound grid upgrades, to allow for ‘distressed distribution’ to tens of millions of points of use, during peak peaks, which will inevitably occur when the wind isn’t blowing in the North Sea and/or the sun isn’t shining on the solar fields around the country.

And here’s the no-brainer. Using a Government guarantee to underwrite a single multi-billion pound project has, by definition, a 1-in-1 exposure to the risk of that project failing and the ‘banker of last resort’ having to pay up, or otherwise bail out the project. Micro-slicing that same type of guarantee into a national programme to equip the UK’s millions of households with Net Zero technology, on the other hand, massively spreads the risk. Reduced to its basics, a 1-in-30,000,000 million risk exposure beats 1-in-1 hands down!

Plans for 2024

No further upgrades or expansions of our GreenTech systems at home are currently planned for 2024. We anticipate simply continuing to operate the system, and continuing eliminate many tonnes of CO2 and save tens of thousands of pounds.

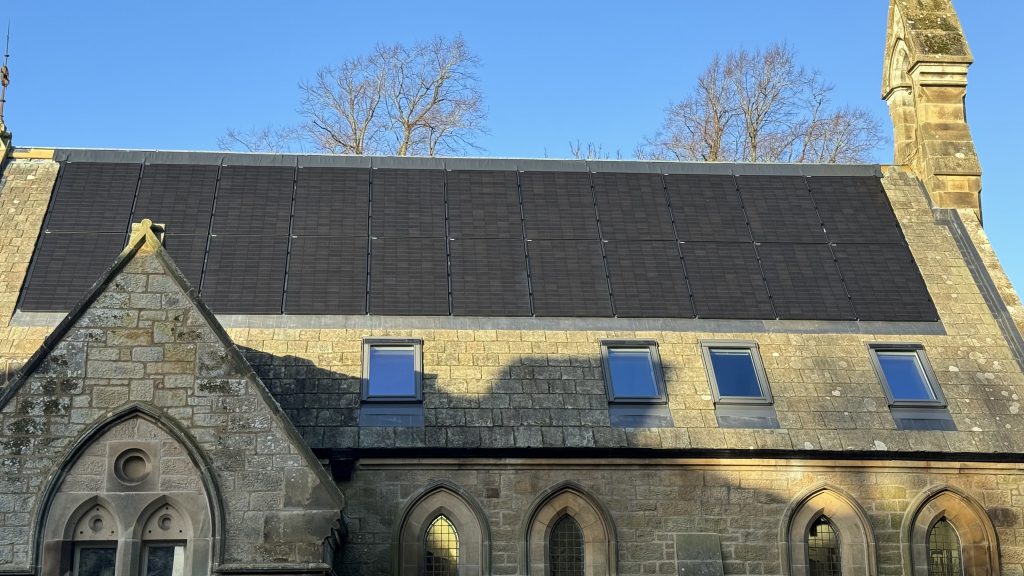
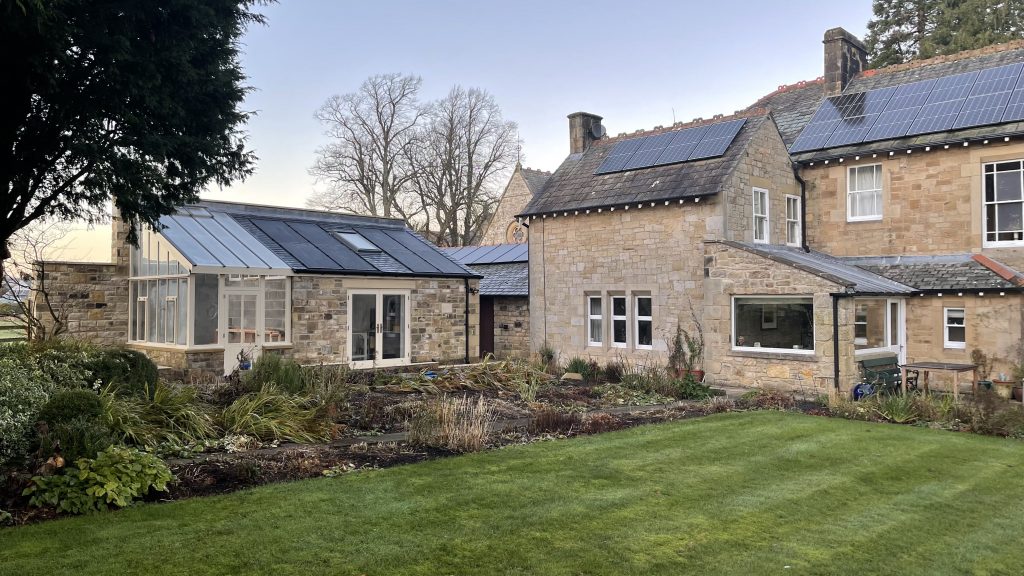
However, we will be completing a very significant new project in the year ahead. We’re taking everything we’ve learned from transforming the energy performance of our home, and are now applying it to the conversion of a redundant 1875 church building into one of the UK’s most energy efficient homes. We believe it to be the first church-to-domestic conversion in the world to Passivhaus standards for ultra-low energy consumption, super-insulation, and airtightness. These standards will massively reduce the Primary Energy Requirement of the building compared to standard home construction.

And the even better news? We’ll be opening Warksburn Old Church as a luxury holiday rental property in late-Summer 2024. We look forward to welcoming you! More information is here, along with the extraordinary history of the Net Zero visionary who funded the original building 149 years ago.

If you are interested in booking a stay, or just want to make an enquiry, please email us on

info@warksburnoldchurch.com

01 January 2024

Switching on renewable generation: 136 years after it was first envisaged

Our project to convert the 19th Century Warksburn Old Church to become an ultra energy efficient 21st Century Passivhaus is now well advanced. If you’re interested, you can follow the conversion project on its dedicated Instagram feed here.

The PDF linked here describes how the church was originally funded in 1875 by the eminent Victorian engineer, Sir George Barclay Bruce and how, when he became President of the Institution of Civil Engineers in 1887, he set out an extraordinary vision of the renewable generation and storage of electrical energy. 

It is uncanny that we now have the privilege of transforming his highly prescient vision of Net Zero into built reality, on the very building which Sir George himself paid for. In bringing the vision Sir George first expressed 136 years ago to life, we are putting everything we have learned about ‘How To Electrify Your Life’ from our GreenTech at home into this project, with one important difference. 

  • At our home, we have simply applied various electric technologies to substitute for other, carbon intensive, ways of powering the building, notably resulting in over 50% of our total carbon saving due to replacing an oil boiler with an Air Source Heat Pump, to power the central heating and hot water
  • At Warksburn Old Church, by contrast, we’re rebuilding the fundamental structure to Passivhaus standards of super-insulation and airtightness, thus fundamentally reducing the Primary Energy Requirement of the building in the first place.

With its helpfully church-sized south facing roof, facing the sun at an acute angle to maximise winter solar generation, and a couple of chunky batteries to store any surplus solar we produce, coupled to an ultra-low energy design, we are expecting Warksburn Old Church to take the ‘next step’. We anticipate a carbon positive building, meaning that, every year, it will generate more energy than it consumes. 

The build programme is on schedule to complete in a few months time. From late-summer 2024, Warksburn Old Church will be open as a three bedroom luxury holiday rental home, sleeping up to six guests. The rebuild to the extremely demanding Passivhaus standard will enable guests to experience for themselves how the highest levels of comfort and luxury can be achieved in a Net Zero building which generates more energy than it consumes, whilst enjoying a holiday in beautiful and historic Northumberland, just north of Hadrians Wall and south of the Scottish border. 

If you are interested in booking a stay, or just want to make an enquiry, please email us on

info@warksburnoldchurch.com

One year, one household: 25 tonnes of CO2 eliminated; £19,000 energy cost saved

Full year data for our energy performance is complete: the results were extraordinary. It really is possible to Electrify Your Life, Save Loads Of Money, And Save The Planet. We have published the results, along with lots of practical advice on what equipment we installed and how we operated it to achieve over £19,000 in energy cost savings and eliminated over 25 tonnes of CO2 emissions.

Major upgrade to our GreenTech

Having proven the cash and carbon benefits of solar, battery and EV set up in 2020, we spent 2021 planning an installing a major upgrade to the system, to really push the limits on carbon reduction, and to enable larger financial savings. In short we added some more solar panels, doubled our battery storage capacity, and added an Air Source Heat Pump to replace the oil boiler that previously supplied our central heating and hot water.

On 01 January 2022 the upgraded system went live, and the financial and carbon savings really started rolling in. Two very important elements which drive the savings are our Evergreen Energy heat pump, which eliminates heating oil, and our Octopus Energy smart grid tariff, which enables us to charge our total 168 kWh of both domestic and EV batteries at cheap off-peak rates. Click the images below to visit our suppliers’ websites for more information.

The two infographics below present, in ultra-summary form, the overall cost & benefit of the upgraded system for the first half of 2022 from 01 January to 30 June.

To see the detailed monthly reports please click the link below. Otherwise just scroll down to read more.

Where our electricity came from & where it went

The first graphic is pretty self explanatory. The inner circle shows where our electricity came from. The outer ring shows where it went. As you’ll see, a pretty substantial slug of it came from ‘home brew’ solar generation, for which we paid £0. The split between solar, off-peak and peak electricity gives us a ‘blended average’ price for the electricity we used.

This second graphic takes this input-output energy mix and the resulting blended average price per kWh as its starting point, and shows the cash and carbon benefits we’ve captured from the operation of our Smart Energy system. If you click the image, you’ll see a copy of the full Year To Date report in PDF.

What our electricity cost & how much cash and carbon we saved

  • The red ‘bullseye’ in the middle is total cost we have paid to date for grid electricity imports – we pay nothing for solar. This powers everything: heating, hot water, all at-home charging of our EVs, normal domestic use, as well as firing Anne’s pottery kiln several times a month.
  • The middle circle shows the savings we’ve made:
    • by using electricity to power our EVs and not buying petrol;
    • by using electricity to power our heat pump and not buying heating oil;
    • by using electricity at the blended average prices our solar & grid mix generates, instead of paying for standard rate electricity at the current price cap rate per kWh;
    • by receiving the minor ‘Feed In Tariff’ (FIT) incentive for some of our solar generation;
    • by receiving the ‘Renewable Heat Initiative’ (RHI) incentive for our heat pump.
  • The outer circle shows how many kg of CO2 emissions we have removed from the atmosphere:
    • by driving EVs instead of petrol/diesel cars;
    • by heating our home and hot water with an Air Source Heat Pump not an oil-fired boiler;
    • by using our solar generated electricity and our energy supplier’s 100% renewably-generated electricity to power everything, as opposed to the UK average emissions per kWh for electricity suppliers.

We’re publishing monthly blog posts with performance data in this thread. We have also updated the financial payback calculations to reflect the upgraded system and present an overview here.

The remainder of this post gives a summary of the main items we focussed on for the 2021/22 system upgrade to effectively turn our home into a ‘Smart Energy Island’

  • Although our existing 24 panel, solar array, rated at 7.5 kWp (kilowatt peak – that’s the standard measure of solar performance under ideal conditions) generated a healthy 5.77 MWh over a year, it was now time to get the final eight panels installed, to complete the planned 10 kWp, 32 panel, array. That had to wait until Anne’s ceramics studio could be built. COVID delayed that by a whole year. The image above shows the completed array: the new bit is on the left, on the studio building with the built-in greenhouse.
  • The 8 final panels are built ‘roof integrated’ actually into studio roof, rather than ‘roof mounted’ on top of it. The panels effectively are the roof of the studio, which handily saves the cost and weight of the slates which would otherwise have been used. Happily, because this ‘solar roof’ sits at a helpful angle facing between the morning and midday sun, a 25% expansion of the solar array is producing about 30% more electricity.
  • Some of that solar production is going into the same to EVs as before: a 100kWh Tesla Model X, and a 30 kWh Nissan Leaf. No change there.
  • The major initial benefit of expanding our solar production was to have more solar surplus energy to store in the two 13.6 kWh Tesla Powerwall batteries we have now installed.
  • But we thought we could probably do more, so we sat down and really thought about it. We did a detailed Cost:Benefit analysis of potentially integrating a major new element into our Smart Energy solution for the home. That element would have to enable us to tackle the really tricky bit of carbon reduction: domestic heating and hot water. We had already done the easy bit by switching to EVs, but we knew that if we really wanted to make a difference we’d have to decarbonise our home’s heating system. And it’s not just us: it’s probably the biggest single challenge the UK faces if we are to achieve Net Zero Carbon by 2050. Just how do we to keep households warm, whilst simultaneously eliminating the 85% of typical household carbon emissions that domestic heating causes?
  • Carbon-wise that led us to the real biggie. We took the plunge and binned our oil fired central heating and replaced it with an Air Source Heat Pump (ASHP) system from Evergreen Energy. We were burning an average of 4,967 litres of heating oil a year. Each litre of heating oil burned emits 2.96 kg of CO2. Because we’re now heating the home and our hot water with 100% renewably-generated electricity instead (our solar and Octopus 100% green grid import on the Go Faster tariff), that’s 14.70 tonnes of carbon dioxide emissions we’ll be taking out every year. That’s in addition to the six tonnes a year we were already saving by using 100% green electricity to ‘fuel’ our EVs and by avoiding grid electricity suppliers who don’t supply exclusively renewably-generated power.
  • Money-wise the fuel cost savings are significant too. Those 4,967 litres of oil cost of £2,640 a year, assuming our the three year average cost of £0.53/litre. In the post-Ukraine world oil is now over £1.00 a litre, so our cost-of-oil-not-purchased savings have doubled. Timing is everything!  We predict a cost saving of around £5,000 a year at mid-2022 prices by replacing our oil-fired central heating and domestic hot water boiler with the heat pump.  That’s just for the heating and hot water, not counting the money we save by driving electric cars and filling domestic storage batteries with solar and cheap off-peak electricity for use at times when electricity is expensive.     
  • And speaking of timing, we squeezed the ASHP in before the abolition of the Government’s Renewable Heat Incentive (RHI) programme in 2021, although the economics would still have worked on oil cost savings alone – all the more so post-Ukraine. If we were installing it in 2022, we’d be using the replacement support scheme, a £5,000 Government grant for eligible ASHP installations.
  • Although heat pumps are at their most efficient when coupled to underfloor heating systems in heavily insulated modern houses, we simply couldn’t rip out 25 radiators in our Victorian-era home without massive disruption. So we accepted a degree of inefficiency and used the ASHP to heat those radiators. But we compensated for this by comprehensively upgrading each radiator with a Smart Thermostatic Radiator Valve (TRV), which we control with Apple HomeKit, to ± 0.5 degrees celsius precision. This enables us to ‘zone’ the house on a room-by-room basis, basically avoiding heating unoccupied space.
  • Finally, all this GreenTech was pushing the limits of what the standard single phase grid supply could safely provide. It is likely that our two EVs and two batteries will all start charing at the same time, particularly in winter, when they’re programmed to switch on at the start of the off-peak super-cheap window for importing grid energy. If Anne’s pottery kiln fires up at the same time, and the heat pump switches itself on, then we’d be overloading our grid connection and could blow the fuse. The solution was to upgrade from a single phase to a polyphase supply. In most of the UK that would be to a three phase connection; in our rural Northumberland location our local Distribution Network Operator (DNO, Northern Powergrid in our case) could only provide a two phase supply.
  • Having gone through the DNO supply upgrade process, we then had to ensure our electricity supplier (Octopus, in our case) upgraded the single phase smart meter to a polyphase unit. This is essential to continue to receive the ‘smart’ Time Of Use Tariff on which much of the cost-saving economics depend.

The time-lapse below shows the installation of the roof-integrated solar panels into the studio roof. They’re exactly the same panels as the eight on the garage roof in the background of the picture at the top of this post. The only difference is that they form an integral part of the roof, rather than sitting on top of it.

Annual Performance Report

So we’ve finally got a full 12 months of data. And we’re very pleased with the results.

Around £5,000 in financial savings.

Over 6 tonnes CO2 emissions avoided.

Over 16,000 miles range charged into our electric cars at home.

Click the image below for the full report, available to view or download as a PDF (16MB)

Annual Performance Summary

If you wish to indulge your inner ElectroGeek, you may be interested in the fully detailed month by month performance reports. We have published this level of detail roughly every month on these blog pages. We have now collated the information into a single PDF, which is available to view or download here. Beware, it’s a large file (c. 55MB) so it may take some time to appear.

September 2020 Performance Report

Finally reached Month 12 of detailed data collection. So now we’ve got a full year’s worth of information on:

  • Consumption: total kWh slurped down by the house and Anne’s electron-munching pottery kiln.
  • Consumption: total kWh ‘fuelled’ into the two EVs.
  • Self-generation: total kWh generated by the 7.5 kWp solar panel installation on the roof.
  • Grid imports: total kWh imported from National Grid, using the 100% renewable Octopus Go smart tariff which provides dirt cheap electricity between 00:30 and 04:30 every night and a slightly below-average cost at all other times.
  • Storage input: total kWh charged into the domestic storage battery, using a mix of only solar generation and off-peak grid electricity.
  • Storage output: total kWh discharged from the domestic storage battery at peak times, avoiding grid imports.
  • Total financial savings from smart electricity generation, storage and discharge over the year’s domestic and pottery kiln consumption.
  • Total mileage charged into EVs, using solar and off-peak electricity.
  • Total financial savings from use of EVs charged on this electricity mix, versus the cost of petrol which would have been required to cover the same mileage in Internal Combustion Engine (ICE) cars.
  • Total tonnes emissions avoided from domestic energy optimisation.
  • Total tonnes emissions avoided by EV use.

You can see or download a PDF summary of the whole year’s data (14MB) by clicking the image below.

Annual Performance Report

Below is the final performance report for the data collection year, September 2020.

It was not a bad month weather-wise, with the Met Office reporting a decent 151 hours of sunshine in our area. The key results are tabulated below.

ItemResult
Solar production524 kWh
Off-peak grid energy imported725 kWh
Peak grid energy imported169 kWh
Peak grid imports avoided by using stored energy from Powerwall battery484 kWh
Total energy consumed (domestic consumption and EV charging)1,418 kWh
Net cost of grid energy, incl standing charge, net of Govt payments for solar£39.88
Cost of 1,162 kWh at UK ‘Big 6’ average rate per kWh£219.75
Saving on 1,162.6 kWh vs UK Big 6 average rate£179.87
Total range charged to EVs, from solar and off-peak grid imports1,194 miles
Actual cost of solar + off-peak grid energy to charge 1,185 miles£15.14
Fuel costs to drive an ICE car 1,185 miles using @35mpg & £1.32/litre£252.55
Saving on 1,185 miles vs cost of motor fuel for same mileage£237.41
Electricity and motor fuel savings in month£417.28
CO2 savings on domestic energy by using solar & 100% renewable grid energy255.2 kg
CO2 savings on 1,185 emissions-free miles versus ICE @ 125.1 g/km240.4 kg
Total CO2 emissions avoided in month495.6 kg
September 2020 Performance Data

The usual monthly calcographic is available for download here or by clicking the image below.

September 2020 Calcographic

August 2020 Performance Report

August 2020 was pretty dull. Coronavirus was still doing its (dull and boring) thing. And the sun only bothered to shine for 136.3 hours in the North East of England. So that meant, inevitably, a pretty dull and underproductive month for our solar micro-generation. However, the Tesla Powerwall domestic battery enabled substantial savings by ‘peak-shifting’. Additionally, the gradual easing of lockdown meant we drove more miles in the EVs. The table below summarises the data.

ItemResult
Solar production564 kWh
Off-peak grid energy imported509 kWh
Peak grid energy imported89 kWh
Peak grid imports avoided by using stored energy from Powerwall battery423 kWh
Total energy consumed (domestic consumption and EV charging)1,162 kWh
Net cost of grid energy, incl standing charge, net of Govt payments for solar£17.26
Cost of 1,162 kWh at UK ‘Big 6’ average rate per kWh£180.21
Saving on 1,162.6 kWh vs UK Big 6 average rate£162.95
Total range charged to EVs, from solar and off-peak grid imports1,185 miles
Actual cost of solar + off-peak grid energy to charge 1,185 miles£13.65
Fuel costs to drive an ICE car 1,185 miles using @35mpg & £1.32/litre£248.97
Saving on 1,185 miles vs cost of motor fuel for same mileage£235.07
Electricity and motor fuel savings in month£398.02
CO2 savings on domestic energy by using solar & 100% renewable grid energy209.3 kg
CO2 savings on 1,185 emissions-free miles versus ICE @ 125.1 g/km238.7 kg
Total CO2 emissions avoided in month448.0 kg
August 2020 Summary

Here’s the link for detailed monthly performance report in PDF format. You can also get the report by clicking the calcographic below.

Follow this link to view the in-month and cumulative impact of August 2020 on payback of the capital costs of our solar, battery and EV charging installation

July 2020 Performance Report

July was a pretty good summer month, by North East England standards. Key results are as follows:

  • 1,215 kWh total energy consumption.
  • 816 kWh solar
  • 314 kWh off-peak grid (100% renewable supplier)
  • 86 kWh peak grid (100% renewable supplier).

Taking into account the minor Government subsidy we receive for solar generation, we once again had a negative net cost of energy, paying minus £5.36 for the month’s electricity.

We fuelled our two EVs (and a Renault Zoe we had on test for the first half of the month) for a total of 758 miles in the month. The ‘fuel mix’ going into the EV batteries was 360 kWh solar and 97 kWh off-peak electricity. This blend produced a total electricity cost for 792 miles of EV motoring of £4.84, or 0.6 pence per mile. Using our normal comparison with a 35mpg OldTech car fuelled at the long-term average of £1.32 per litre, we saved £262 fuel costs in month.

The total net financial benefit in July was £384.93, made up of these £262.08 fuel savings and the £122.86 difference between the price we would have paid for 758 kWh of domestic energy at ‘Big 6’ utility company rates (£117.50) and the net minus £5.36 we actually paid.

Emissions avoided in the month by the combination of solar generation, 100% renewably sourced grid supply, and 792 miles of zero emissions driving totalled 378 kg.

Click the graphic below to download the full report in PDF format.

July 2020 energy input blend and usage

Here comes the sun, here comes the sun, and I say it’s alright…(June 2020)

Other than the ongoing mass death virus thingy and associated economic implosion, June 2020 was an exceptionally pleasant month in the UK. As anyone with solar panels will tell you, it was very, very sunny indeed towards the end of the month, although the MetOffice recorded only about 165 hours of bright sunshine in June in our region, compared to the positively Arabian 269 hours which had beaten down on us in May.

Whatever the Bracknell stats geeks say, we ended up with enough sunshine to produce another month with negative cost of energy. As the calcographic below shows, although we consumed nearly a megawatt of electricity for domestic use and charging EVs during this (still a bit lockdowny) month, we actually ended up £12.19 better off in net terms at the end of the period.

The £36.12 Government payment for 740 kWh of solar generation was more than the £23.93 cost of importing the meagre 225 kWh of grid electricity we did not generate ourselves in the month, which includes £7.50 of ‘standing charge’ fixed fee for grid connection at £0.25/day.

Our two EVs were charged roughly 70% with solar (195kW), plus 30% (82kWh) with zero carbon off-peak energy supplied at only 5p/kWh on the Octopus Go tariff overnight rate. Coronavirus ensured that June 2020 was still a very travel-restricted period, so we only covered 593 miles. However, even over this relatively small mileage, that still added up to fuel savings versus petrol/diesel ICE cars of £160.40. The electric ‘fuel’ for the EVs cost us just £4.10 in the month, which works out at only 0.7 pence per mile! It would have cost us £164.49 to travel the same distance in ICE cars, using our standard mpg calculations.

We also won big-time on our 719 kWh domestic consumption. 76% (545 kWh) was solar, including 374 kWh which was stored in the Powerwall stationery battery during the sunshine hours and used in the evenings. The remaining 24% (173 kWh) was zero carbon source grid electricity from Octopus. And over half of the grid imports were stored during the super-cheapo off-peak hours into the Powerwall and discharged at zero additional cost to us during the peak period.

Taking into account the solar generation payment we received from Government, our 719 kWh of domestic energy cost us minus 1.7 pence per kWh, making minus £12.19 net. If we had bought those kWh at UK ‘Big 6’ average rates, we would have paid £111.37. So that’s a net financial benefit of £123.56 for domestic energy consumption.

Putting domestic energy savings and motor fuel savings together, net financial benefit was £283.96 in the month of June. And the planet was 298.6 kg of CO2 emissions better off too.

Please click the image below for a downloadable PDF of the detailed monthly report. The impact of this month on financial payback of system costs is here.