Finally reached Month 12 of detailed data collection. So now we’ve got a full year’s worth of information on:
- Consumption: total kWh slurped down by the house and Anne’s electron-munching pottery kiln.
- Consumption: total kWh ‘fuelled’ into the two EVs.
- Self-generation: total kWh generated by the 7.5 kWp solar panel installation on the roof.
- Grid imports: total kWh imported from National Grid, using the 100% renewable Octopus Go smart tariff which provides dirt cheap electricity between 00:30 and 04:30 every night and a slightly below-average cost at all other times.
- Storage input: total kWh charged into the domestic storage battery, using a mix of only solar generation and off-peak grid electricity.
- Storage output: total kWh discharged from the domestic storage battery at peak times, avoiding grid imports.
- Total financial savings from smart electricity generation, storage and discharge over the year’s domestic and pottery kiln consumption.
- Total mileage charged into EVs, using solar and off-peak electricity.
- Total financial savings from use of EVs charged on this electricity mix, versus the cost of petrol which would have been required to cover the same mileage in Internal Combustion Engine (ICE) cars.
- Total tonnes emissions avoided from domestic energy optimisation.
- Total tonnes emissions avoided by EV use.
You can see or download a PDF summary of the whole year’s data (14MB) by clicking the image below.
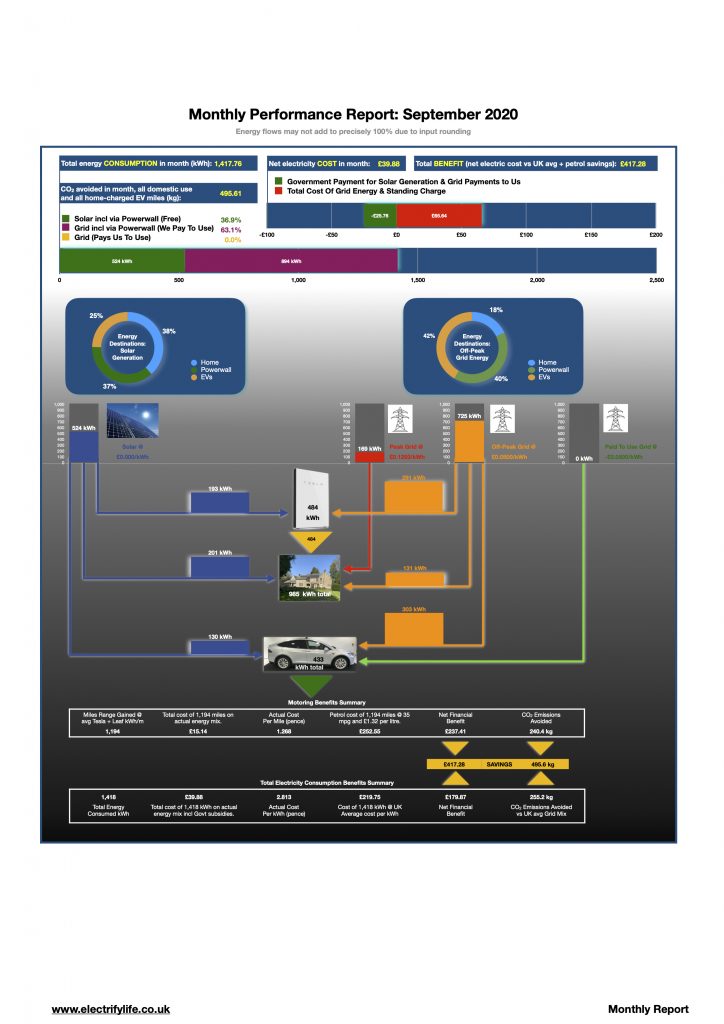
Below is the final performance report for the data collection year, September 2020.
It was not a bad month weather-wise, with the Met Office reporting a decent 151 hours of sunshine in our area. The key results are tabulated below.
| Item | Result |
|---|---|
| Solar production | 524 kWh |
| Off-peak grid energy imported | 725 kWh |
| Peak grid energy imported | 169 kWh |
| Peak grid imports avoided by using stored energy from Powerwall battery | 484 kWh |
| Total energy consumed (domestic consumption and EV charging) | 1,418 kWh |
| Net cost of grid energy, incl standing charge, net of Govt payments for solar | £39.88 |
| Cost of 1,162 kWh at UK ‘Big 6’ average rate per kWh | £219.75 |
| Saving on 1,162.6 kWh vs UK Big 6 average rate | £179.87 |
| Total range charged to EVs, from solar and off-peak grid imports | 1,194 miles |
| Actual cost of solar + off-peak grid energy to charge 1,185 miles | £15.14 |
| Fuel costs to drive an ICE car 1,185 miles using @35mpg & £1.32/litre | £252.55 |
| Saving on 1,185 miles vs cost of motor fuel for same mileage | £237.41 |
| Electricity and motor fuel savings in month | £417.28 |
| CO2 savings on domestic energy by using solar & 100% renewable grid energy | 255.2 kg |
| CO2 savings on 1,185 emissions-free miles versus ICE @ 125.1 g/km | 240.4 kg |
| Total CO2 emissions avoided in month | 495.6 kg |
The usual monthly calcographic is available for download here or by clicking the image below.