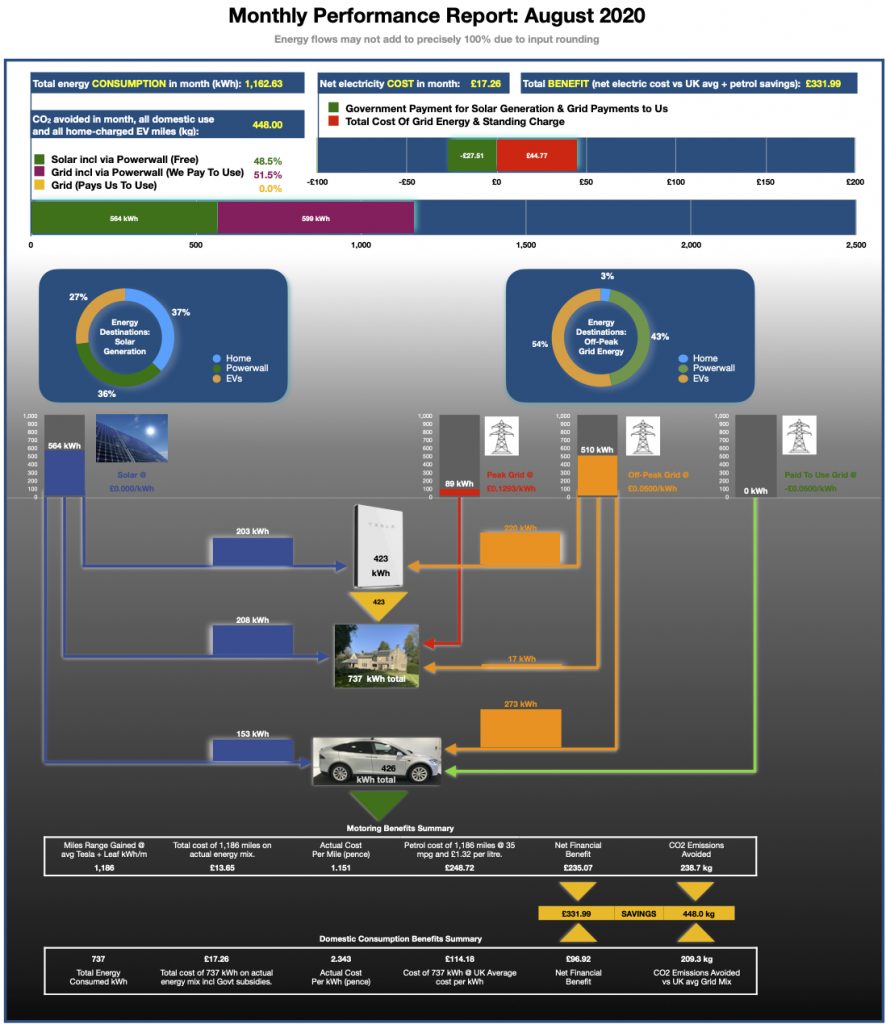
August 2020 was pretty dull. Coronavirus was still doing its (dull and boring) thing. And the sun only bothered to shine for 136.3 hours in the North East of England. So that meant, inevitably, a pretty dull and underproductive month for our solar micro-generation. However, the Tesla Powerwall domestic battery enabled substantial savings by ‘peak-shifting’. Additionally, the gradual easing of lockdown meant we drove more miles in the EVs. The table below summarises the data.
| Item | Result |
|---|---|
| Solar production | 564 kWh |
| Off-peak grid energy imported | 509 kWh |
| Peak grid energy imported | 89 kWh |
| Peak grid imports avoided by using stored energy from Powerwall battery | 423 kWh |
| Total energy consumed (domestic consumption and EV charging) | 1,162 kWh |
| Net cost of grid energy, incl standing charge, net of Govt payments for solar | £17.26 |
| Cost of 1,162 kWh at UK ‘Big 6’ average rate per kWh | £180.21 |
| Saving on 1,162.6 kWh vs UK Big 6 average rate | £162.95 |
| Total range charged to EVs, from solar and off-peak grid imports | 1,185 miles |
| Actual cost of solar + off-peak grid energy to charge 1,185 miles | £13.65 |
| Fuel costs to drive an ICE car 1,185 miles using @35mpg & £1.32/litre | £248.97 |
| Saving on 1,185 miles vs cost of motor fuel for same mileage | £235.07 |
| Electricity and motor fuel savings in month | £398.02 |
| CO2 savings on domestic energy by using solar & 100% renewable grid energy | 209.3 kg |
| CO2 savings on 1,185 emissions-free miles versus ICE @ 125.1 g/km | 238.7 kg |
| Total CO2 emissions avoided in month | 448.0 kg |
Here’s the link for detailed monthly performance report in PDF format. You can also get the report by clicking the calcographic below.
Follow this link to view the in-month and cumulative impact of August 2020 on payback of the capital costs of our solar, battery and EV charging installation
