2024 full year data is now available for energy performance, cash savings, and emissions reduction at our home, resulting from our use of electricity for all our driving, heating, lighting, and all other domestic uses. The results, summarised in this infographic are strongly positive, and have maintained the astounding carbon savings results achieved in 2023.
In short, we eliminated 27.932 tonnes of CO2 emissions and saved £18,130 in cash.

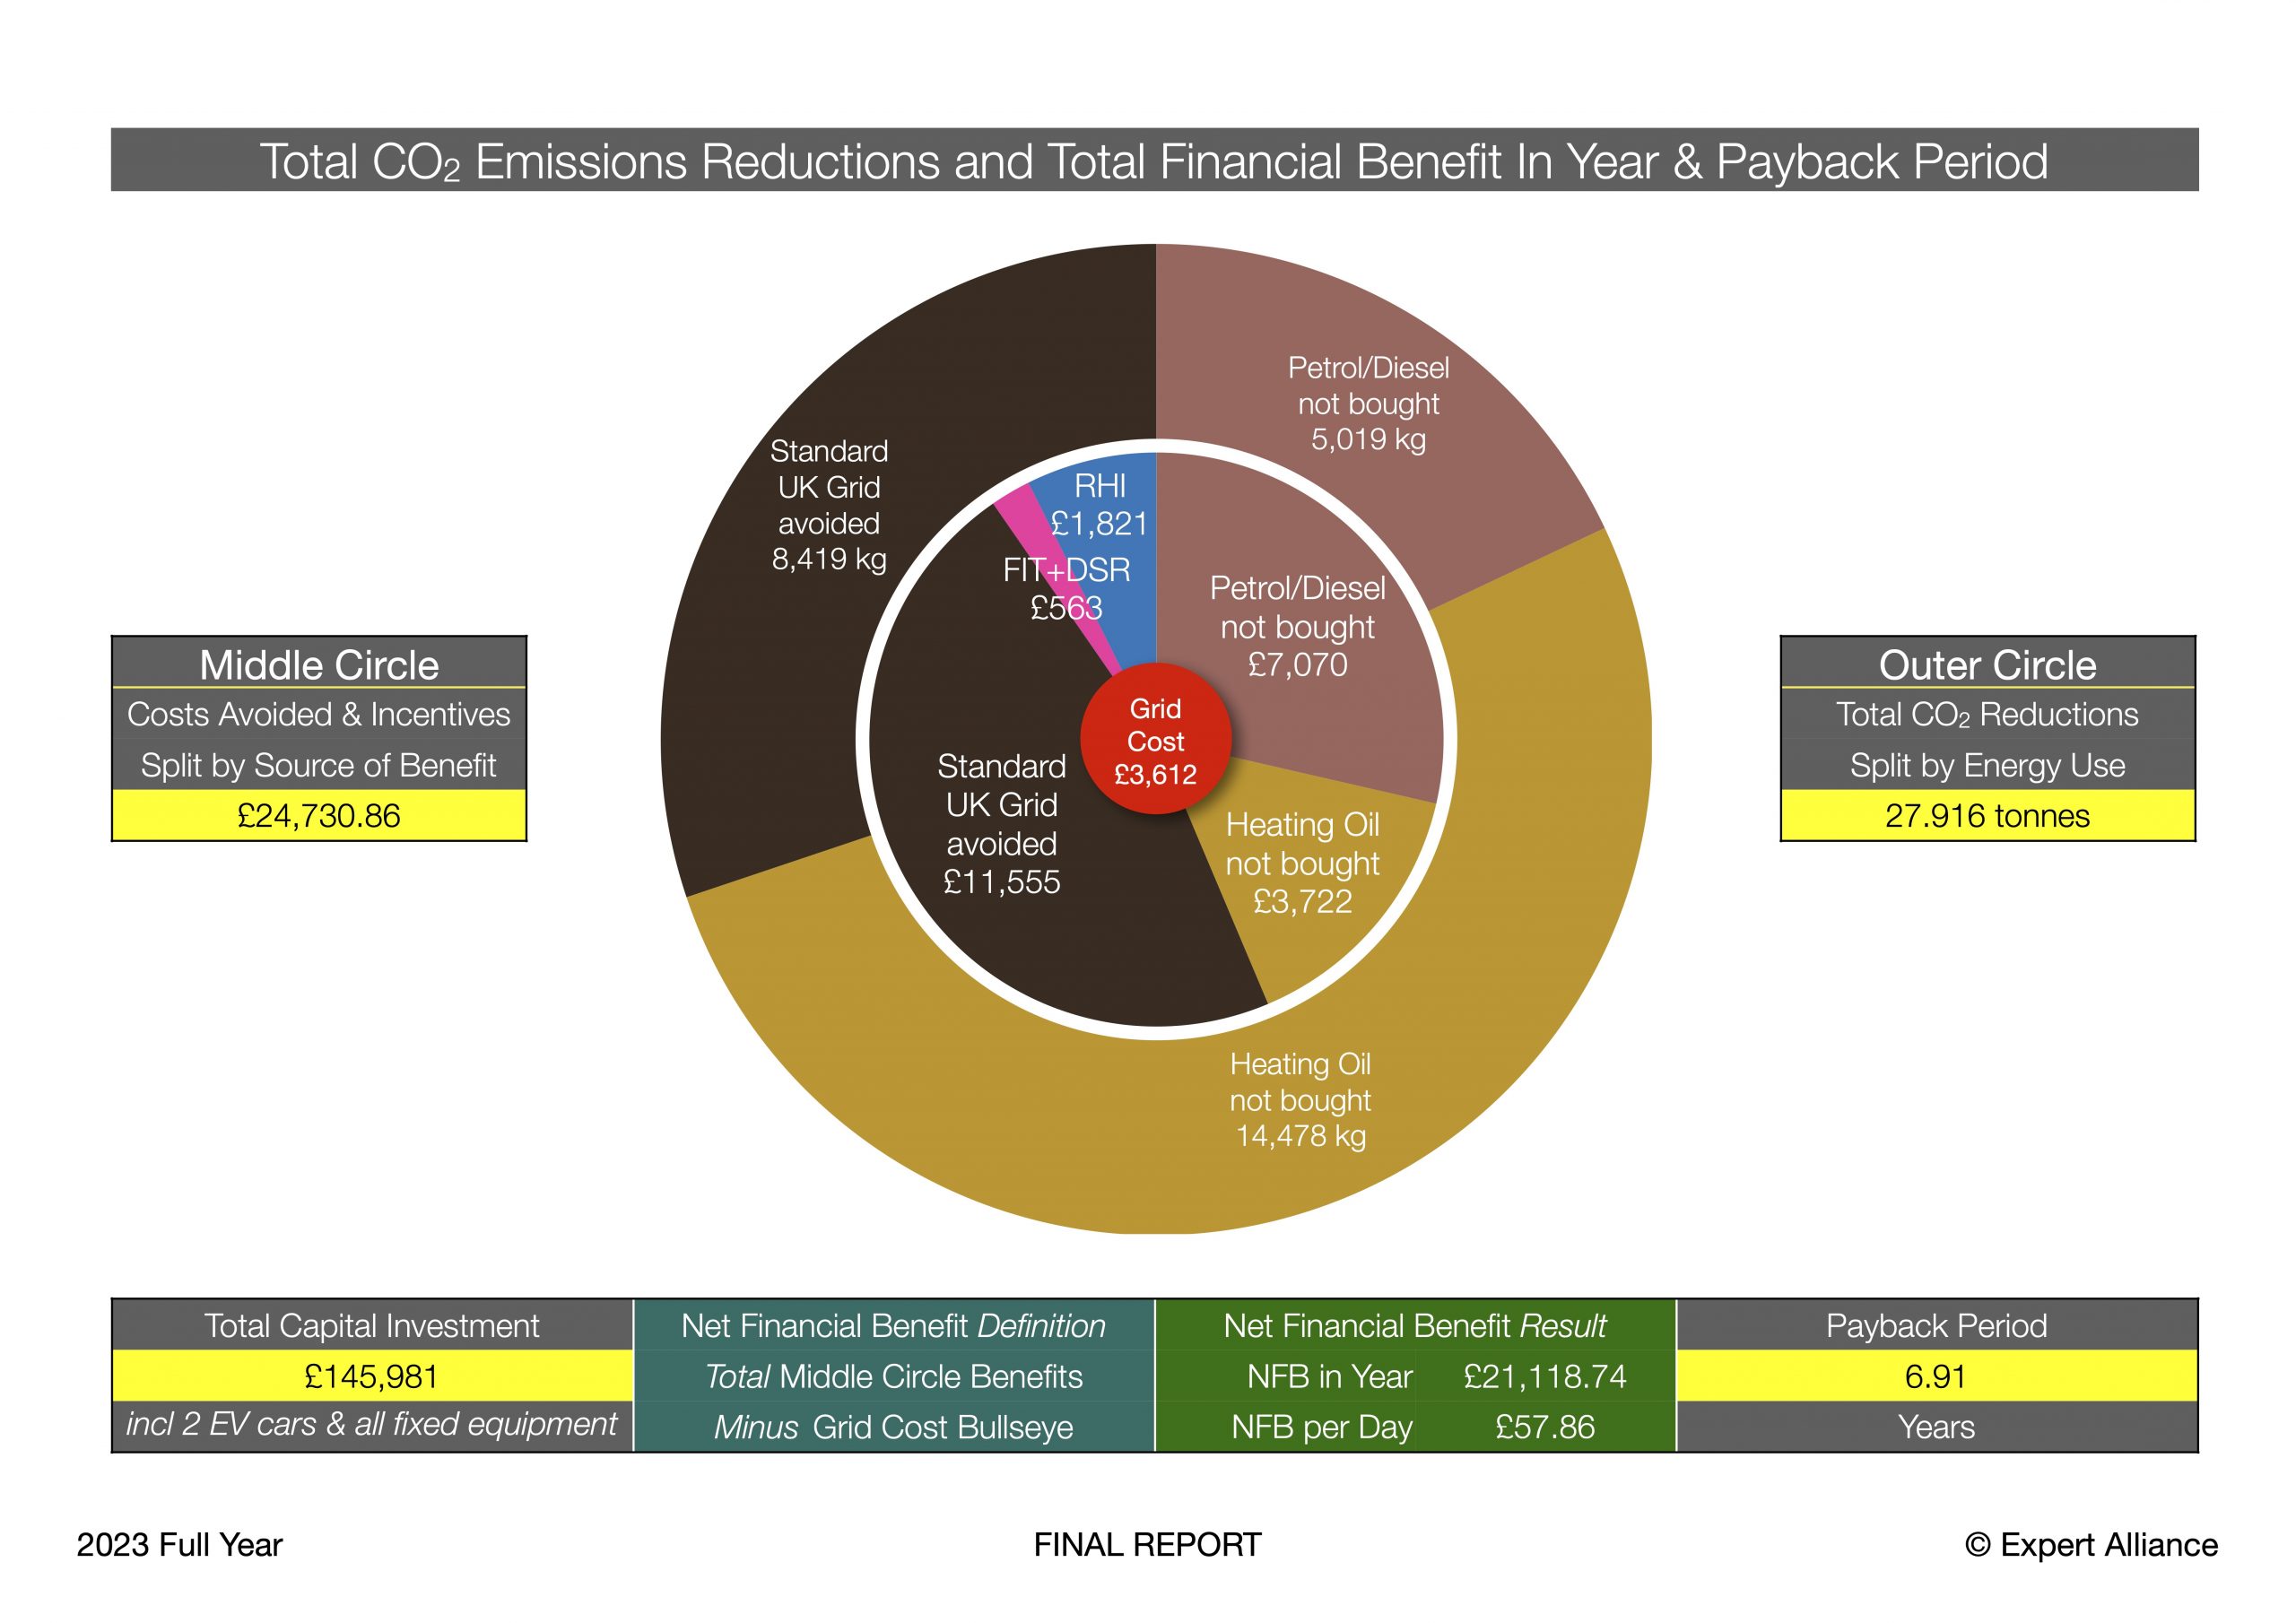
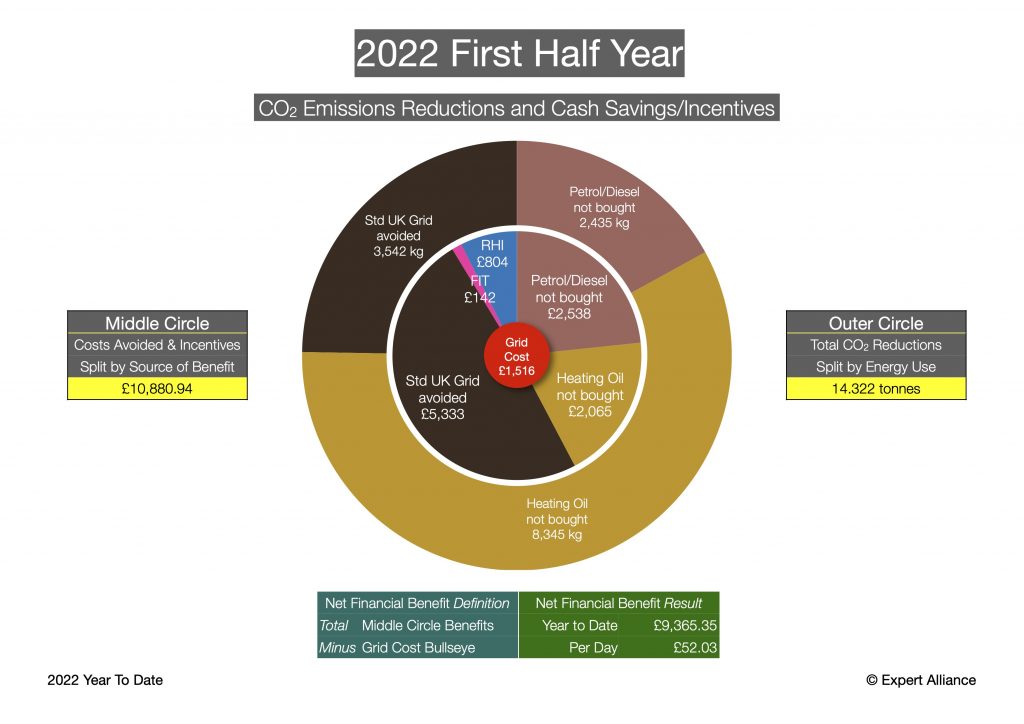
Our savings of 27.932 tonnes of CO2 emissions and £18,130.35 in cash, are calculated compared to an ‘OldTech’ baseline as follows:
- Driving 21,815 miles (35,108 km) in EVs, rather than petrol cars of equivalent size, saved us over £5,800 in cash and eliminated just under 5 tonnes of CO2 emissions.
- Using an Air Source Heat Pump (ASHP), rather than an oil boiler, for central heating and domestic hot water, saved us £3,600 versus the cash we would have had to pay for heating oil, and eliminated around 14.6 tonnes of CO2 emissions. It remains the single most significant policy challenge for Government progressing the Net Zero Transition that the financial savings achieved by switching from fossil fuel heating to electric-powered (and hence potentially zero emissions) heat pumps are relatively small, which discourages people from ‘making the switch’. This is important because the carbon savings of making that switch away from gas heating (which can never be zero emissions) are enormous. Incentives urgently need adjustment to turbocharge the transition of millions of home from dinosaur-fuelled heating to heat pumps – which can be powered by Britain’s ever increasing renewable generation (with a bit of nuclear), assuming the inevitable intermittency of renewables ‘buffered’ by once-in-a-century investment in energy storage.
- Maximising the use of our on-site batteries to import cheap off-peak grid power, and to store the surplus energy from our 7.5MWh of on-site solar generation, saved us well nearly £10,000 in cash compared to the UK regulated ‘Price Cap’ rate per kWh. Using an officially-certified 100% renewable electricity tariff also eliminated around 8.6 tonnes of CO2 emissions compared to the UK grid average for all suppliers.
- We also received just over £2,400 in Government incentive payments, which pay out gradually over time to offset some of the upfront costs we incurred for installing some of the solar array (Feed In Tariff – FIT) and the ASHP (Renewable Heat Initiative – RHI).
- A small part of the incentives received, only £55 this year, was paid by our energy supplier for our participation in the National Grid Demand Flexibility Service. DFS pays consumers not to use electricity at times of grid stress, which typically occur when renewable generation is low and demand is high in the evening peaks. Not using electricity in these periods reduces the need to switch on polluting coal and gas fired power stations. Because we have 39 kWh of battery storage available, we are able reduce our grid consumption to absolute zero during the DFS ‘Savings Sessions’. OFGEM has seriously reduced the rates paid to consumers for participation in DFS: this is a step in the wrong direction and should be reversed; the Net Zero Transition absolutely requires households to be incentivised to store energy when the grid needs to dump surplus renewables.
The ‘hard cash’ economics worked out as set out below.
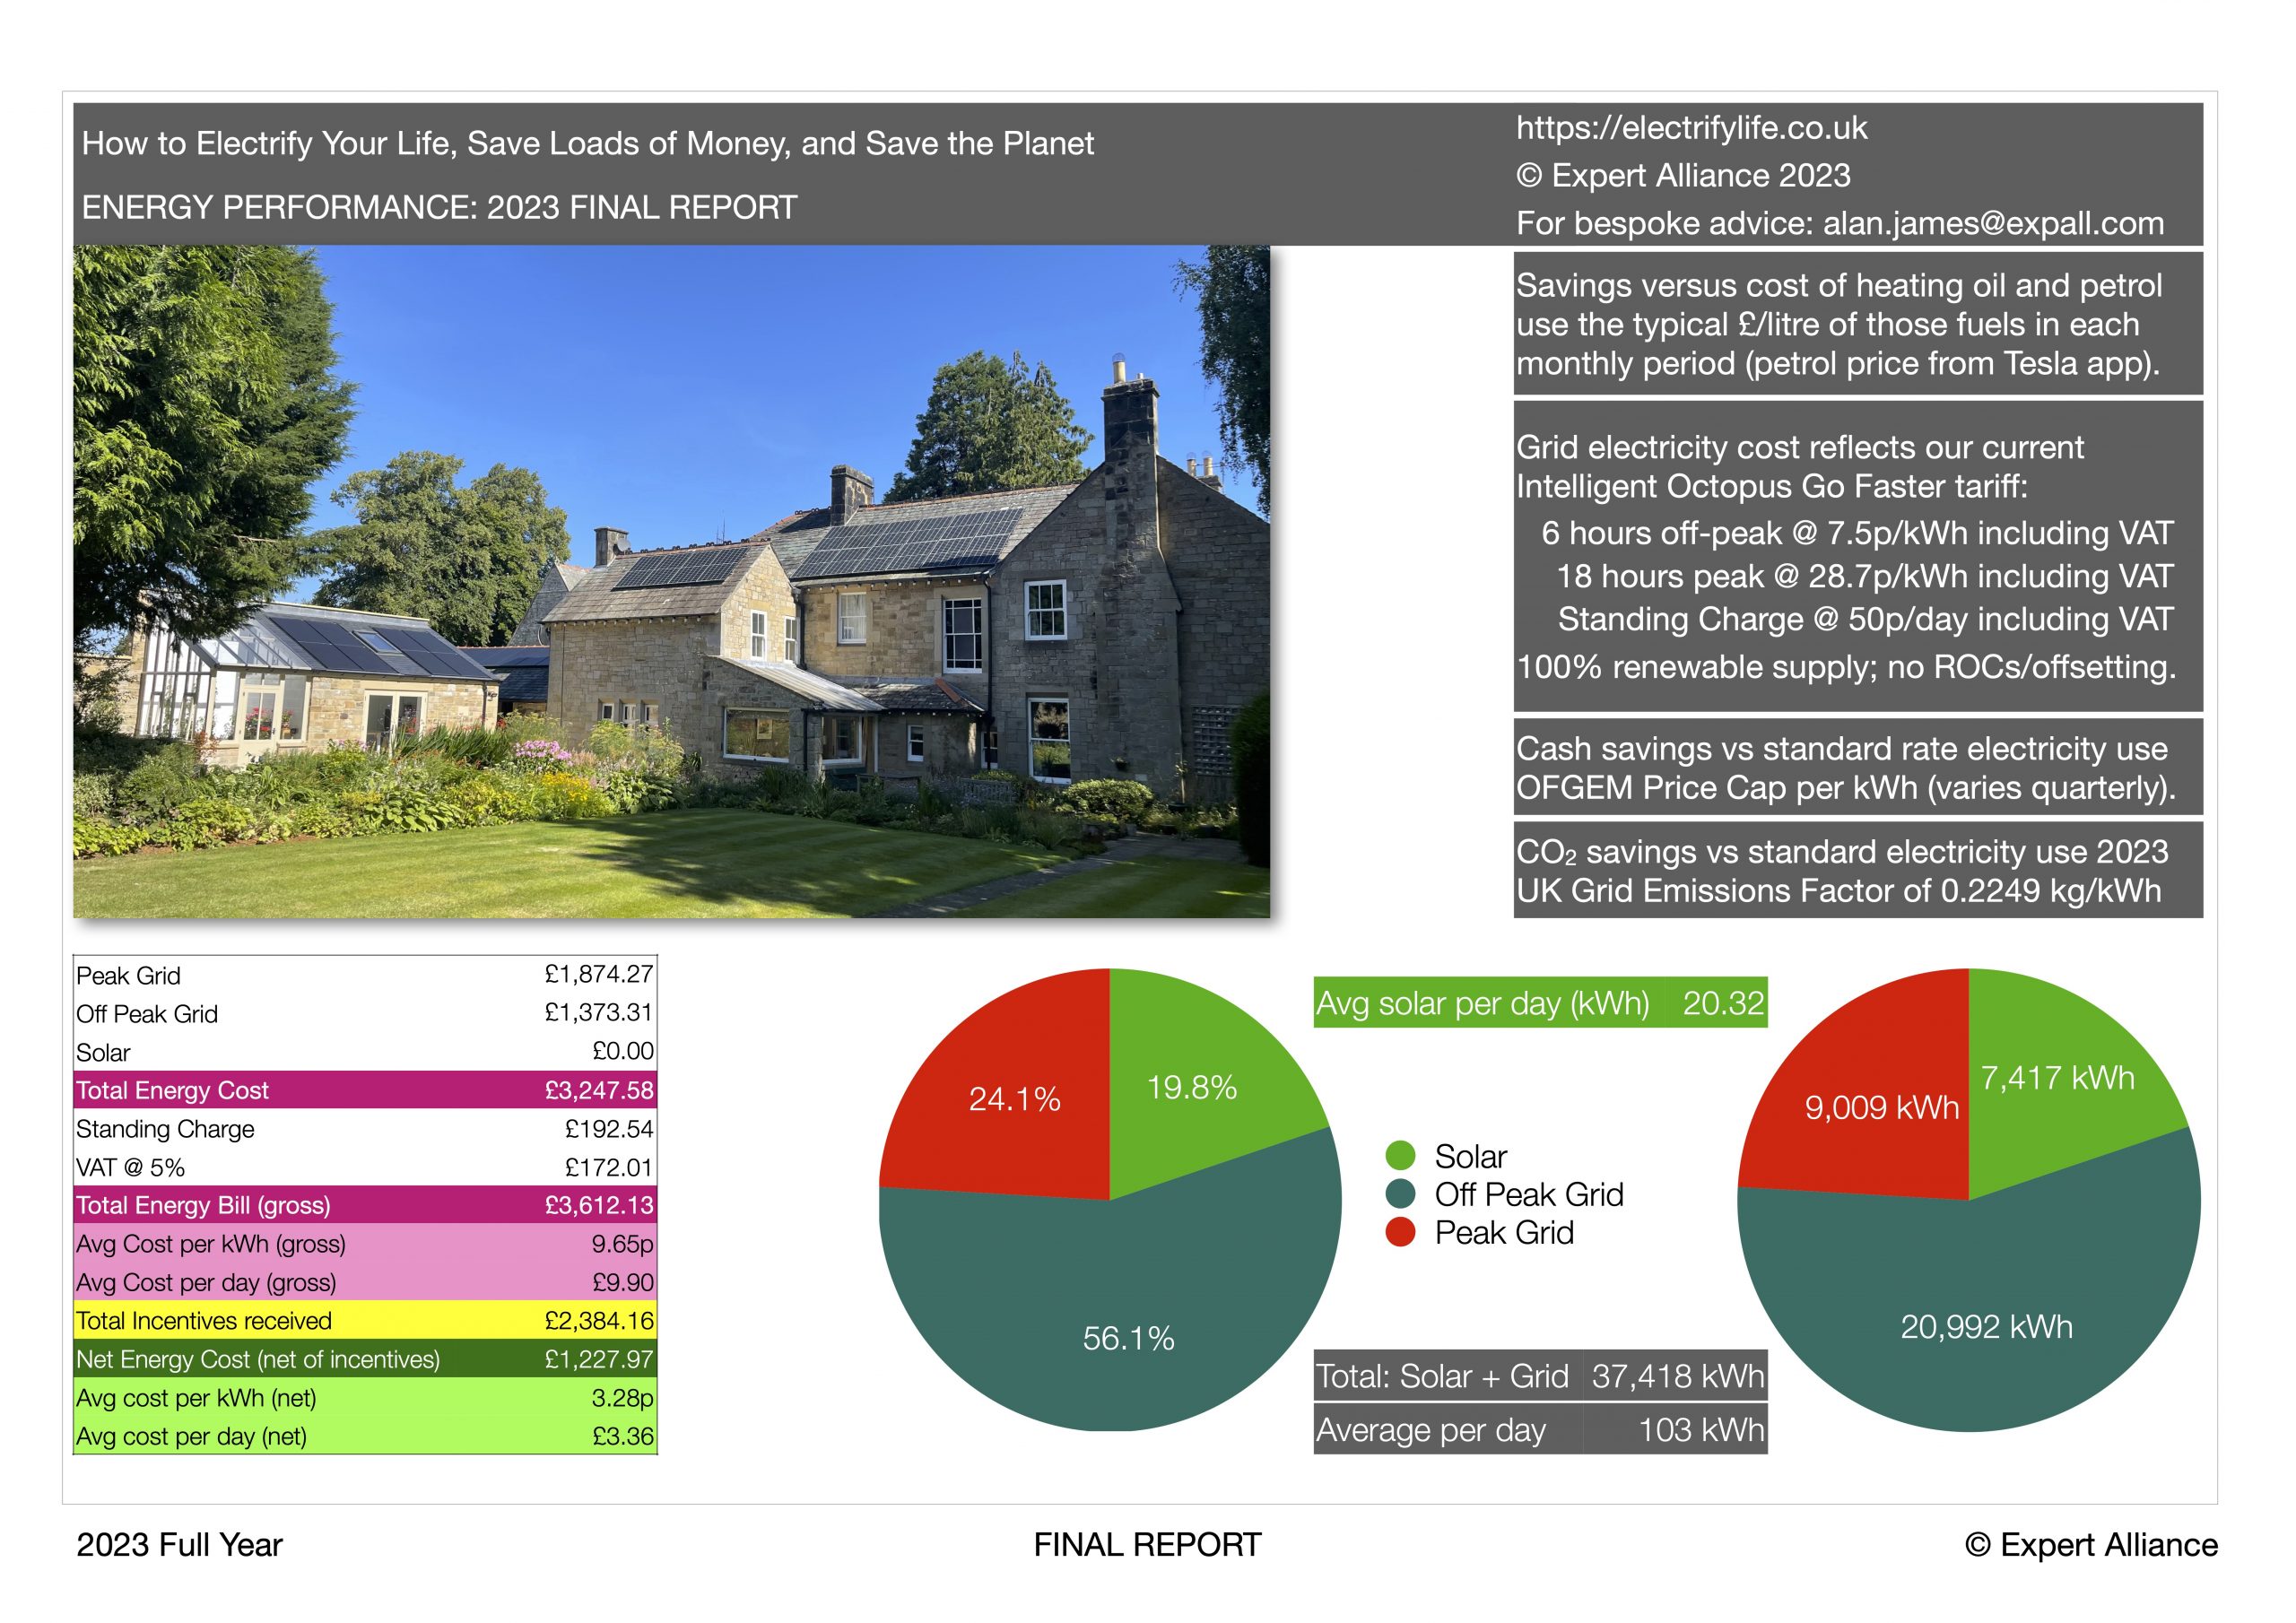
- Our total energy cost for 2024 was was £3,930 paid to our grid electricity supplier. This one cost covers all the energy we used to power and heat our home, and to power the 21,815 miles (35,10 km) we drove in our cars.
- Offsetting this cost, we saved a total of £19,575 by not buying petrol for the cars, by not buying heating oil for a boiler, and by leveraging our batteries to access a Smart Energy grid supply tariff and therefore not buying energy at the OFGEM ‘price cap’ rate for standard rate electricity.
- Further offsetting the cost, we also received a total of £2,485 in FIT, RHI and DFS incentive payments.
- The 2024 full year Net Financial Benefit to us was £18,130. (£19,575 + £2,485 – £3,930)
- Our total net cost of energy for the full year 2024 was only £1,445.33, covering all home and motoring consumption. This result is produced by subtracting the £2,484.92 incentive payments we received from the £3,930.25 bill we paid to our grid electricity supplier.
- Therefore, our total energy cost was only £3.96 per day, Although this figures is higher than the £3.28 we achieved in 2023 on broadly similar total consumption, it remains less than the typical £4.05 price of a Grande Cappuccino at a well-known coffee chain. The increase was largely due to the increased costs of grid energy caused by the war in Ukraine fully feeding through in this year.
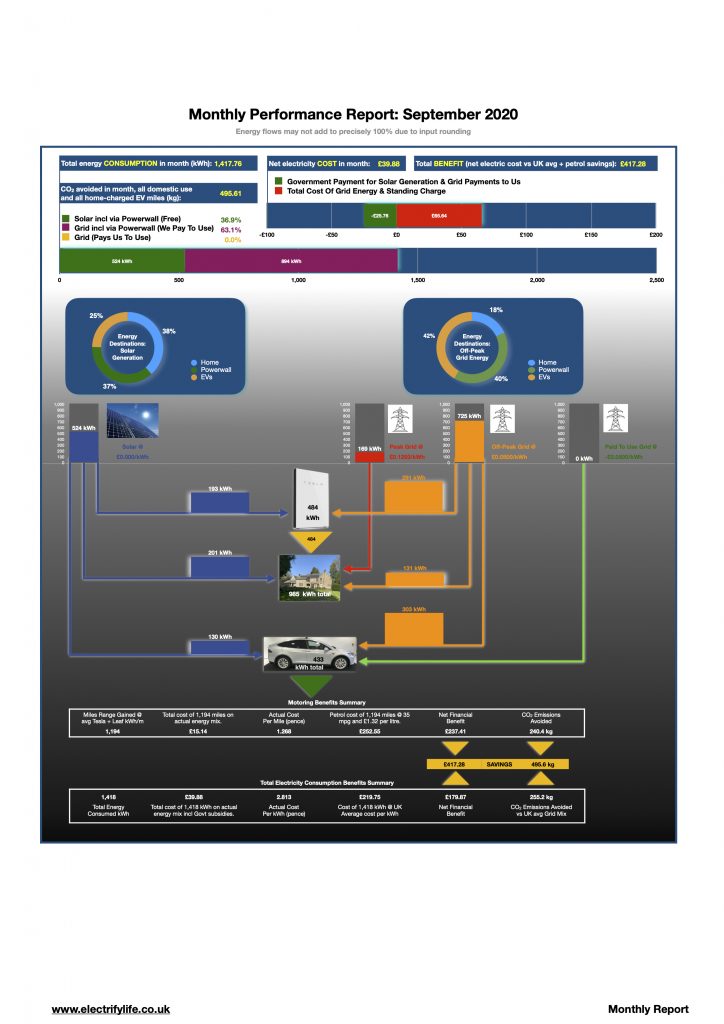
- The net price we paid for electricity after incentives was only 3.77p per kWh, averaged over the year. Again this was up from 3.22p/kWh last year, due the impact of increased grid prices, although these were massively cushioned in our case by our ability to ‘buffer’ cheap off-peak grid electricity in our on-site batteries for use in peak hours. This takes into account our mix of 18.5% solar, 62.8% off-peak grid, and only 18.7% peak grid usage. 3.77p/kWh compares very favourably with the OFGEM ‘price cap’ rate, which varied between 21.34p/kWh and 28.17p/kWh (+5% VAT) during 2024, in our grid region (Northern England).
- We achieved these savings using the Intelligent Octopus Go Faster tariff for our grid energy. This excellent package works really well for us, providing a minimum of 6 hours cheap overnight electricity at around 25% of the peak-hours cost, but it’s only available to customers who have an electric vehicle. Here’s a link if you’d like to know more. If you sign up to Octopus via the link you will receive £50 off your first bill. For full disclosure, we will receive a £50 referral bonus.
During 2024 the difference in cost between off-peak and peak electricity prices remained significant, again as a result of the Ukraine war. This meant our 2023 decision invest in one further Tesla Powerwall battery, additional to the two already installed, paid off in 2024. This increased capacity to import very cheap overnight off-peak electricity, which now costs around four times less than peak-time power, was invaluable in keeping our overall cost of energy down, even against a backdrop of very elevated energy price and the cost of living crisis
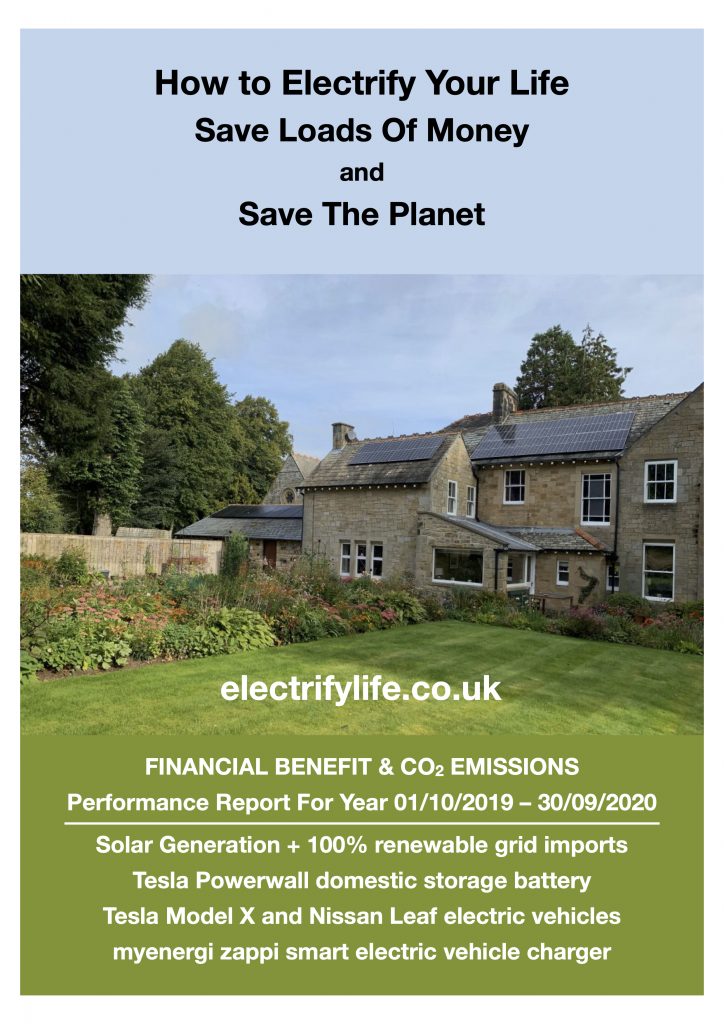
As noted, adding battery capacity in 2023 increased the total capital we have invested to nearly £146,000, but bear in mind that this figure includes two EV cars (a Tesla Model X and a Nissan Leaf), in addition to a 32 panel solar array, and the 3 Tesla Powerwall batteries. These items were all installed in phases over approximately a decade from 2014 onwards, and a complex ASHP system was added in late-2021. We made no further capital investment during 2024.
Despite the heavy up-front capex, the system is performing ahead of projections, and is on course to fully pay back the £146,000 investment cost in a total of 6 years 11 months, averaged over the last three years results. Taking into account the lower savings we achieved as parts of the system were gradually installed over the seven year period 2014 to 2021, plus the £19,000 we saved in 2022, our £21,000 savings in 2023, and the £18,000 saved this year, we’re accounting the system as 87.32% paid-off at 31 December 2024. Depending on the amount of sunshine and the price of grid energy, we are sticking with our December 2023 projection that we expect the system to have fully paid for itself by around mid-2025, fully including the cost of both cars. From that point onwards, it’s ‘pure upside’.
Comprehensive data is available in the 2024 Final Report here. It’s a 15 page PDF which presents the information summarised here in full. It can also be accessed by clicking the image at the end of this post.
For comparison, you can view the 2023 Final Report here. In that year, we saved £21,118 in energy costs, and eliminated 27.916 tonnes of CO2 emissions.
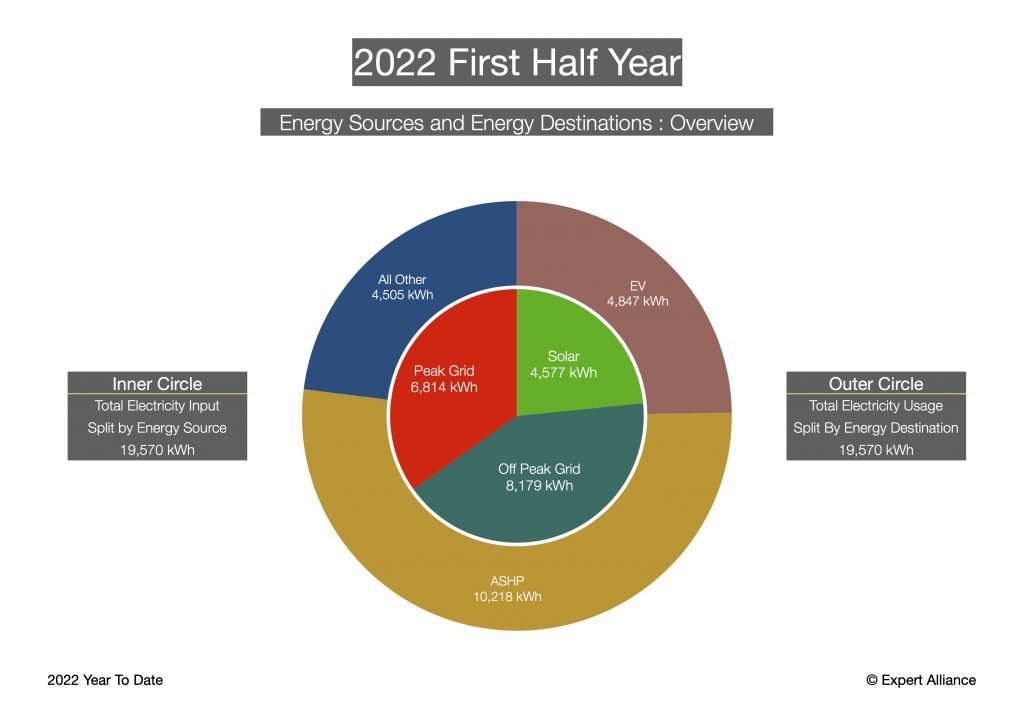
For comparison, you can view the 2022 Final Report here. In that year, we saved £19,089 in energy costs, and eliminated 25.5 tonnes of CO2 emissions.
Net Zero Passivhaus also completed in 2024
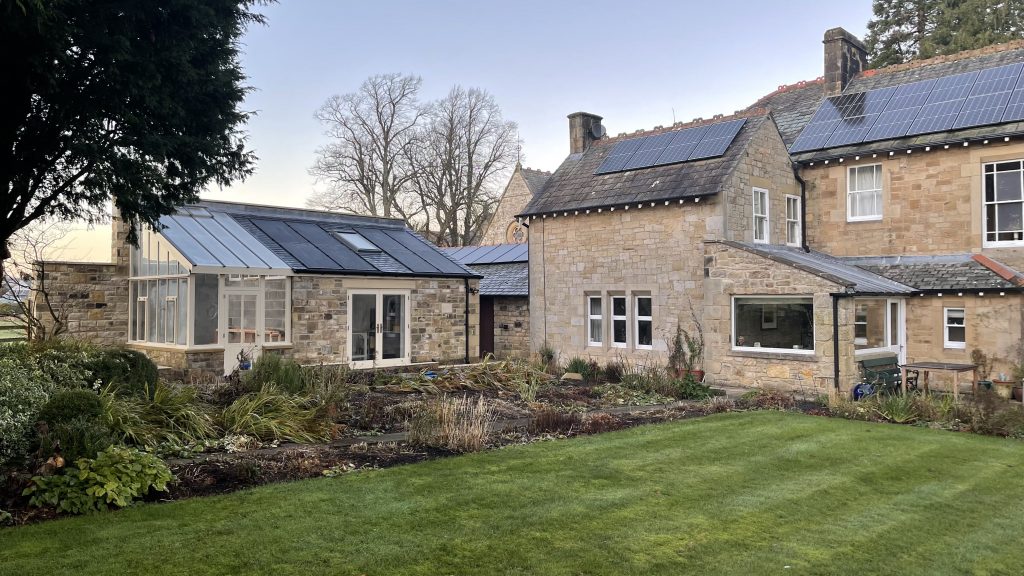
Whilst we made no further upgrades or expansions of our GreenTech systems at home in 2024, we did com complete a very significant new project during the year. We took everything we had learned from transforming the energy performance of our home, and ‘are now applying it ‘turned it up to 11’ as part of conversion the redundant 1875 church which sits in our front garden, into one of the UK’s most energy efficient homes.

We are thrilled and delighted that Warksburn Old Church is now officially certified as the first church-to-domestic conversion anywhere in the world to have achieved Passivhaus standards for ultra-low energy consumption, super-insulation, and airtightness. The Passivhaus ‘fabric first’ approach massively reduces the Primary Energy Requirement of the building compared to standard home construction; so much so that the building now generates more energy than it consumes over the course of a year, and exports over 3 MWh to the National Grid.
And the even better news? Warksburn Old Church is now open as luxury holiday rental property in beautiful rural Northumberland, close to Hadrians Wall, Hexham and Kielder. We look forward to welcoming you! If you’d like to enjoy a stay in Net Zero luxury, please book direct on our website, where you’ll always find the best deals.
01 January 2025